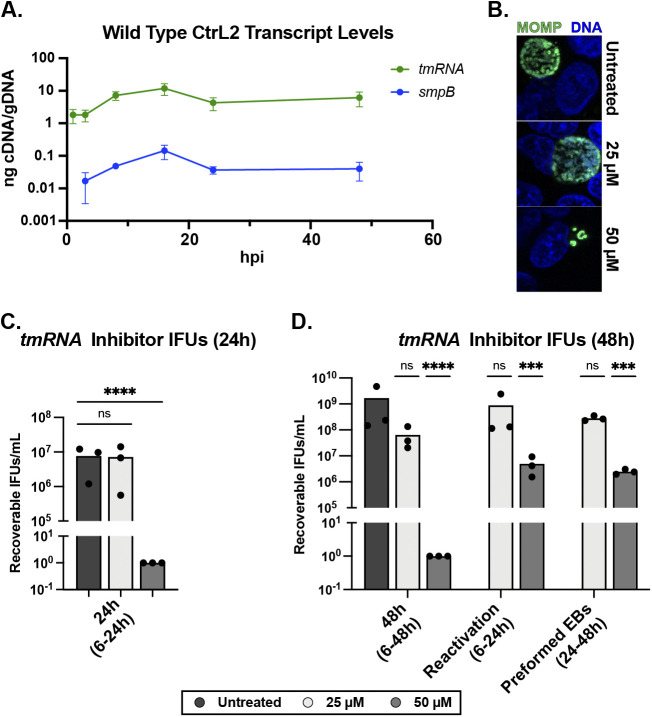
FIG 3.
Testing the essentiality of trans-translation to chlamydial development. (A) Time course RT-qPCR analysis of tmRNA and smpB transcript levels. RNA and gDNA were harvested, processed, and quantitated as described previously. Values are plotted on a log10 scale. Data are plotted as the average of three biological replicates. (B) Immunofluorescence assay of MBX-4132 treatment at 24 hpi. Chlamydial MOMP in green, and DNA in blue. (C and D) Shown are results of 24 hpi (C) and 48 hpi (D) IFU analysis following treatment with the trans-translation inhibitor MBX-4132. Treatment windows are as described in the figure. Recoverable IFUs were plotted on a log10 scale. Values were log transformed for normalcy prior to analysis. ***, P < 0.001; ****, P < 0.0001; ns, not significant by ordinary two-way ANOVA with Dunnett’s post hoc multiple-comparison test; all compared with the untreated control.

