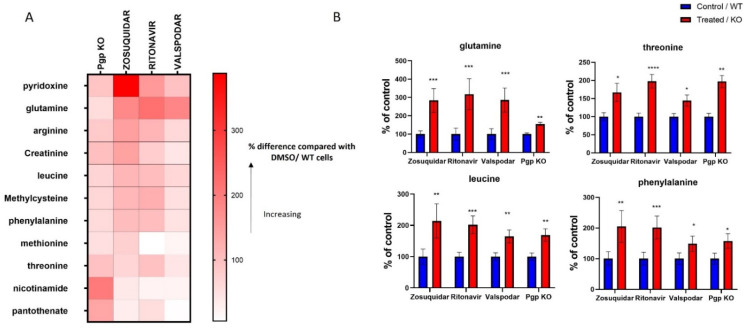
Figure 1.
Heat map (A) and bar graphs (B) representing changes in metabolites induced by Pgp inhibition in cells. The data represent changes in metabolites in response to Pgp KO and Pgp inhibition by zosuquidar (5 µM), ritonavir (10 µM), valspodar (50 nM). The data representing changes in zosuquidar inhibition were acquired from 3 individual experiments, each experiment was performed with a minimum of 6 replicates, and the data are presented as the mean of 3 repeats. The data from other inhibitors and Pgp KO represent the mean of 1 independent experiment, which was performed with at least 6 replicates. (A) The data are presented as the percentage change compared with control (DMSO/WT). (B) The data were normalized by dividing the mean (peak area) of treated/KO group with the control group and are presented as a percentage (mean ± SEM) of the control group. Significance of these results was determined using Mann–Whitney test, results with * p < 0.05, ** p < 0.01, *** p < 0.001, **** p < 0.0001 were considered significant.

