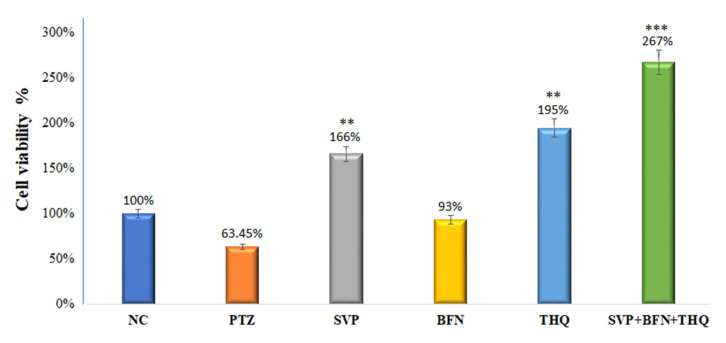
Figure 7.
% cell viability of HEK-293 cells by MTT assay. The cells were first exposed to PTZ (0.6 µg/mL), and later with different concentrations of SVP (120 µg/mL), BFN (1.50 µg/mL), THQ (12.0 µg/mL) and SVP + BFN + THQ (120 + 1.5 + 12.0 µg/mL) for 24 hr. The % of cell viability is given in the graph is taken from the dose which gives the highest percentage of cell viability. ** p < 0.01, *** p < 0.001.

