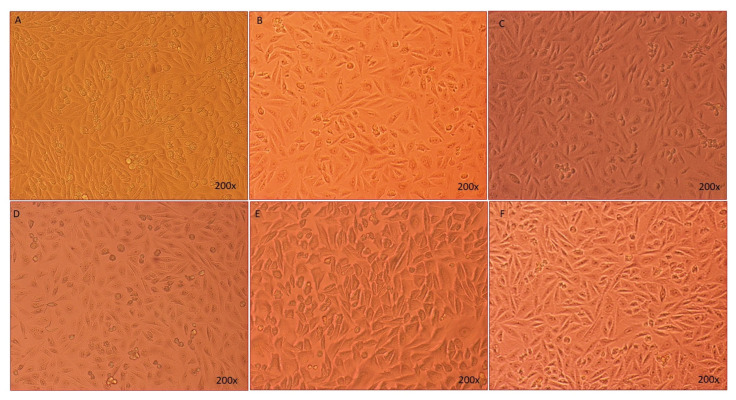
Figure 8.
The morphological representation of the HEK-293 cells taken by light microscope. (A) Non treated HEK-293 cells; (B–E) PTZ (0.6 µg/mL), SVP (120 µg/mL), BFN (1.50 µg/mL), THQ (12.0 µg/mL); (F) SVP + BFN + THQ (120 + 1.5 + 12.0 µg/mL). The cells were first treated with PTZ for 24 h, then were treated with SVP, BFN and THQ and SVP + BFN + THQ for 24 h. Magnifications 200×.

