
FIG 3.
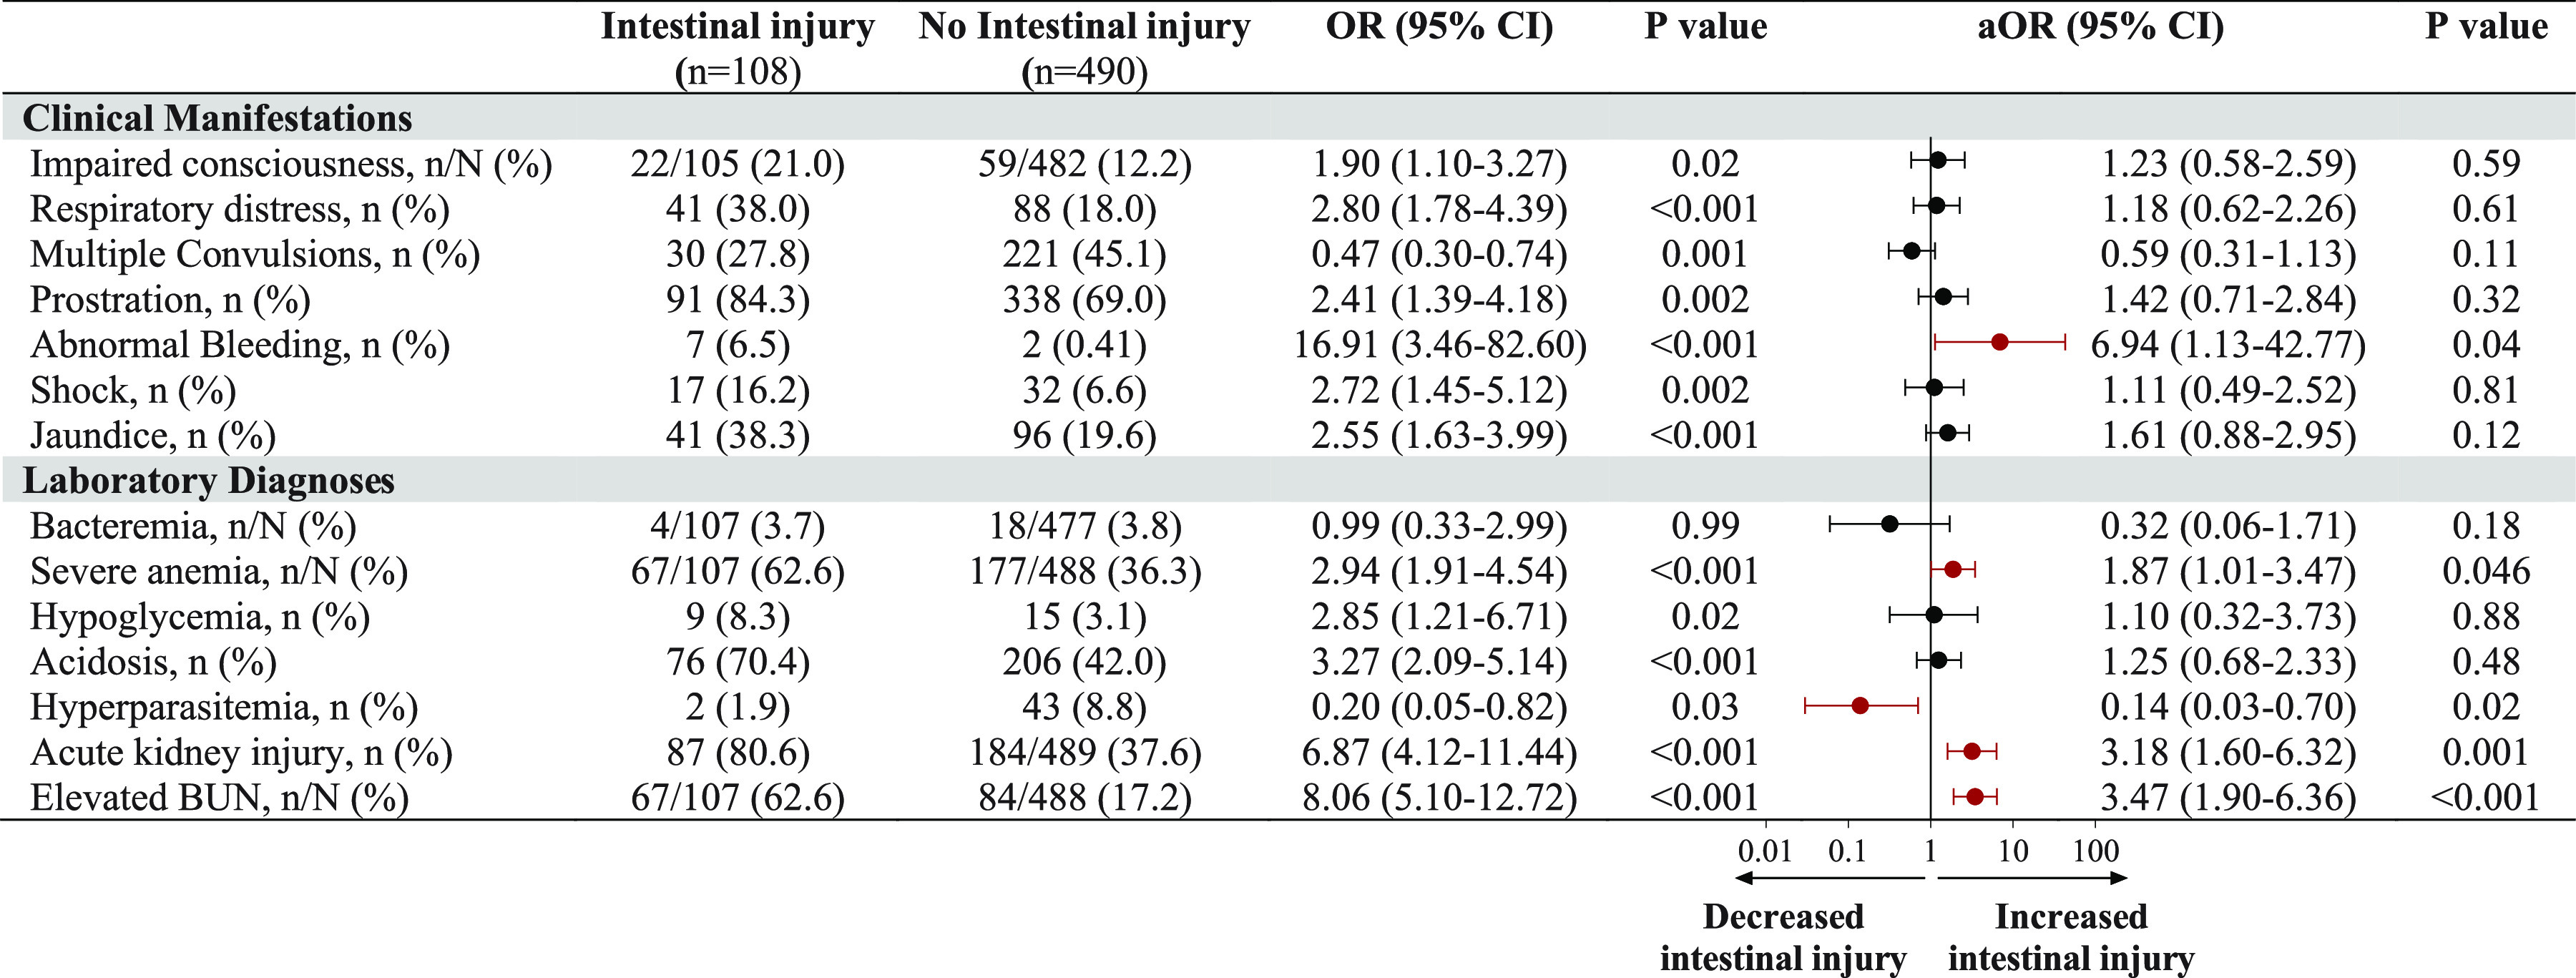
Associations between clinical complications with intestinal injury. Shown are forest plots depicting the adjusted odds ratio (OR) and 95% confidence interval (CI) from logistic regression models with intestinal injury at enrollment and clinical manifestations of severe malaria as well as laboratory diagnosis. Unadjusted OR and P values are shown to the left of the forest plot, and the adjusted OR (aOR), adjusted for all complications, age, sex, and study site, is shown to the right. Significant results are presented in red.