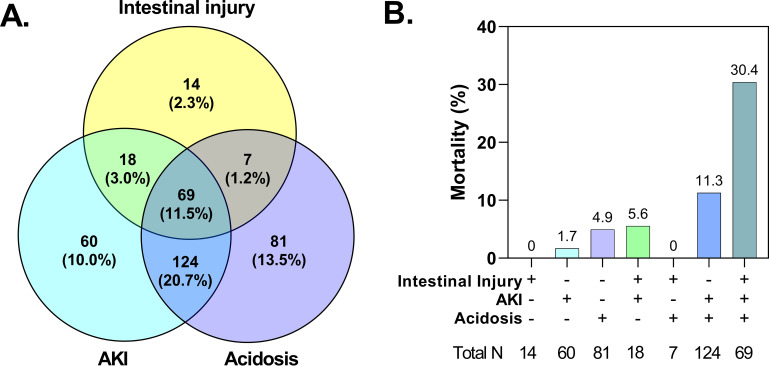
FIG 4.
Interrelationships between acute kidney injury (AKI), acidosis, and intestinal injury and mortality. (A) Venn diagram showing the number and frequency of children with each complication among the 596 children with acute kidney injury, acidosis, and intestinal injury defined. (B) Bar graph showing the frequency of in-hospital mortality corresponding to each section of the Venn diagram based on the presence of AKI, acidosis, and intestinal injury.

