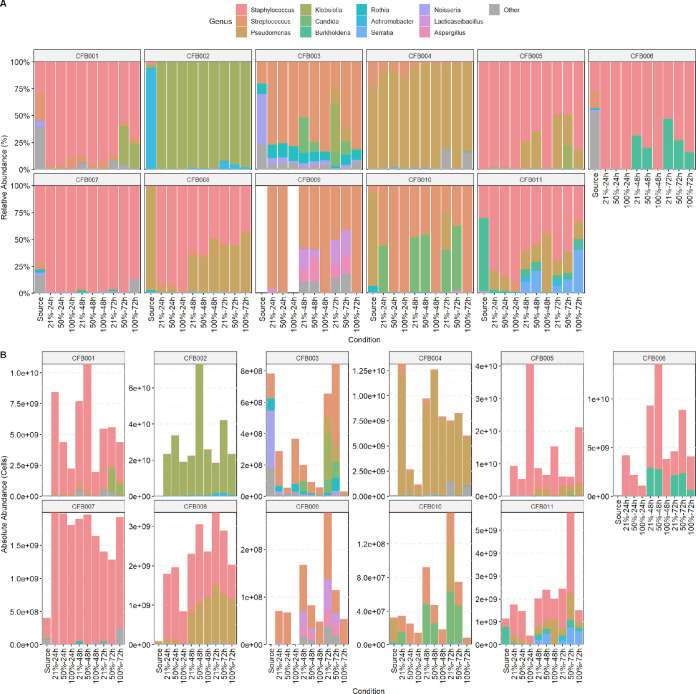
FIG 3.
Per-participant sputum community taxonomic profiles. Leftmost “source” bar corresponds to uncultured sputum samples; the remainder represent the nine culture conditions. Colors correspond to the 12 most abundant genera, with the remainder grouped in gray as “other.” (A) Relative abundance community profiles, grouped by study participant. (B) Absolute abundance community profiles, grouped by study participant. Calculated using spike-in bacteria. The y axis differs between study participants due to differences in microbial load.

