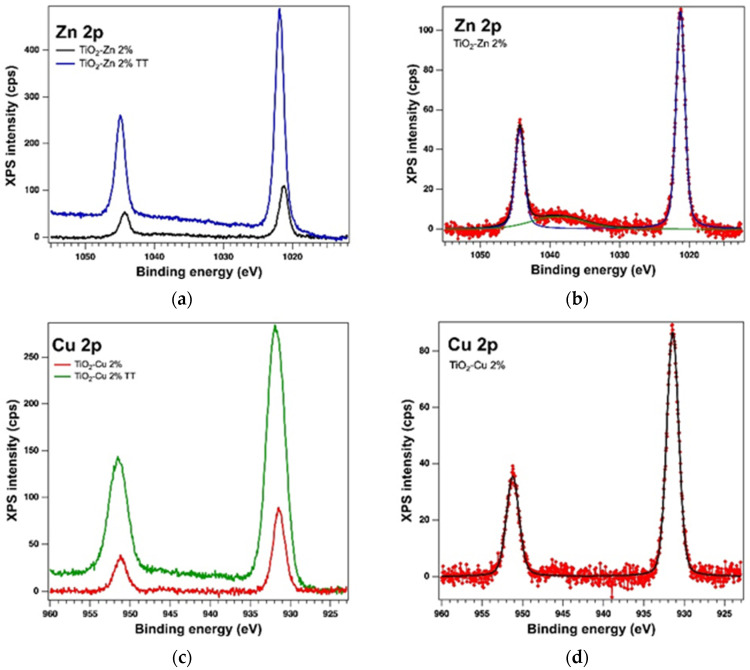
Figure 7.
XPS spectra of the core levels Zn 2p (a) and Cu 2p (c) overlayed XPS spectra of both kinds of samples and the experimental data (red symbols) with the fit and deconvolutions for (b) the sol−gel sample with Zn (deconvolutions: components C1–blue line and C2–green line) and (d) the sol−gel sample with Cu (only one component–black line).

