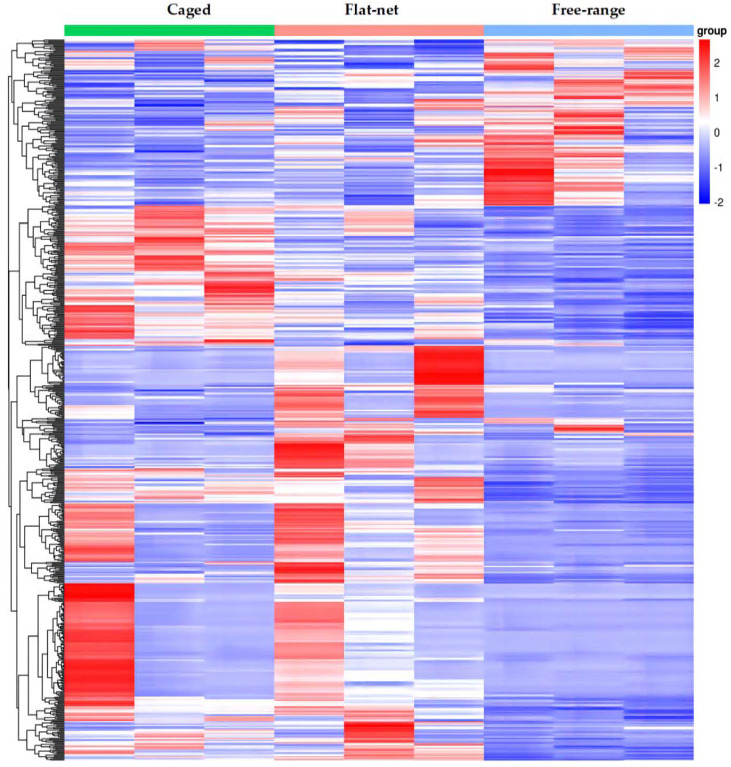
Figure 1.
Gene expression clustering heat map under three rearing systems. Each column in the heat map represents the expression of different genes in the same sample, and each row represents the expression of the same gene in different samples. Red genes are up-regulated, and blue genes are down-regulated in the affected samples.

