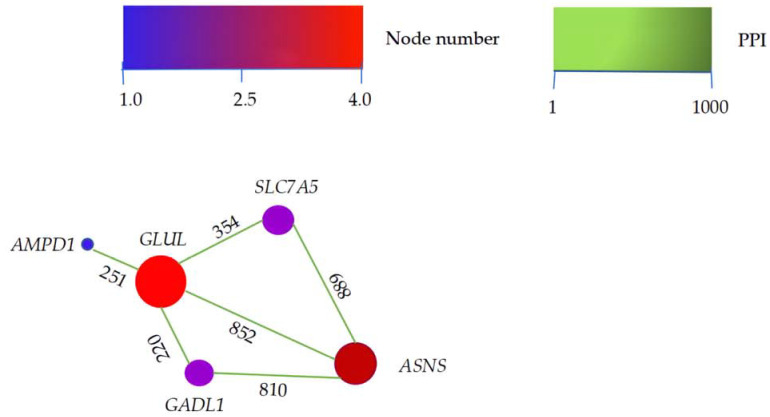
Figure 3.
PPI network of candidate differently expressed genes. In the network, the higher the score of the interacting genes, the deeper the color of the lines between them, indicating a stronger interaction between two genes. The lines are directional, with the source gene pointing to the target gene along the direction of the number on the line. The larger the circle representing the gene, the more the interactions of the gene.

