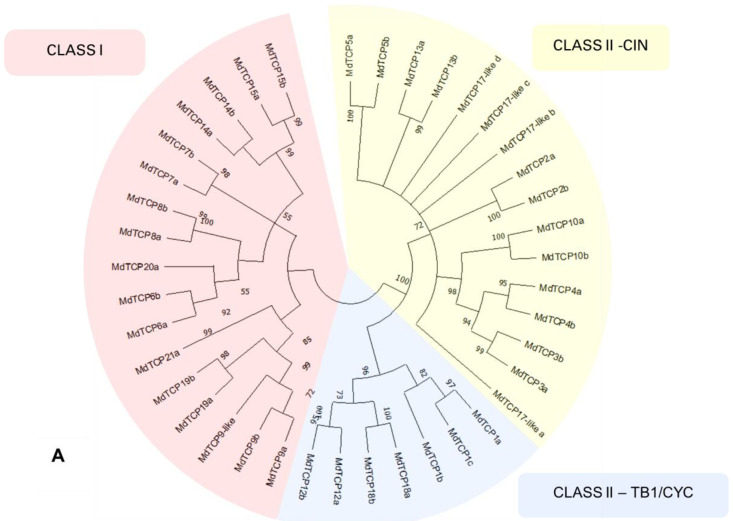
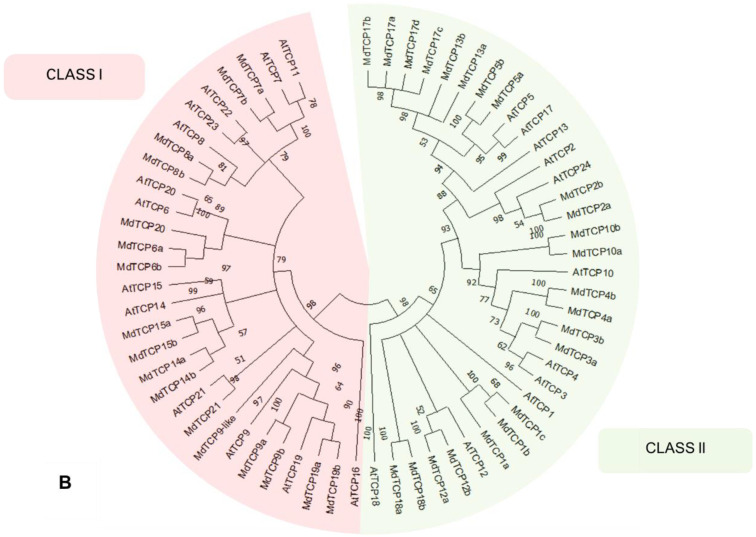
Figure 4.
(A) Phylogenetic tree calculated on the 40 MdTCP genes classified in the present work. The different classes of TCPs are indicated with red (Class I), yellow (Class II-CIN) and blue (Class II–TB1/CYC). The tree was inferred using the neighbor-joining method [27] with 10,000 bootstrap re-iterations. Evolutionary distances were computed using the Poisson correction method [28] and are in the units of the number of amino acid substitutions per site. The rate variation among sites was modeled with a γ distribution. All positions with less than 60% site coverage were eliminated; i.e., fewer than 40% alignment gaps, missing data, and ambiguous bases were allowed at any position (partial deletion option). Node support is indicated as bootstrap values, and nodes with a support lower than 50 are collapsed. Analyses were conducted in MEGA X [22]. (B) Phylogenetic tree calculated from the amino acid sequences of the 40 MdTCP genes identified in the present work, and 24 AtTCPs. Members of the Class I are indicated with a red background, while those in Class II are indicated with a green background. Smart Model Selection algorithm [29] with Akaike Information Criterion (AIC) was applied to calculate the appropriate evolution model. The phylogenetic tree was inferred with the Jones–Taylor–Thornton substitution model, discrete γ distribution with three parameters, proportion of invariable site, and empirical amino acid frequencies count (JTT + G + I + F). Initial trees for the heuristic search were obtained by automatically applying the neighbor-join and BioNJ algorithms to a matrix of pairwise distances estimated using the JTT model and finally selecting the topology with the superior log-likelihood value (−37420,02). Nodes with a support lower than 50 are condensed. Analyses were conducted on PhyML 3.0 software [30] (Guindon; accessed from Bolzano/Bozen, Italy).


