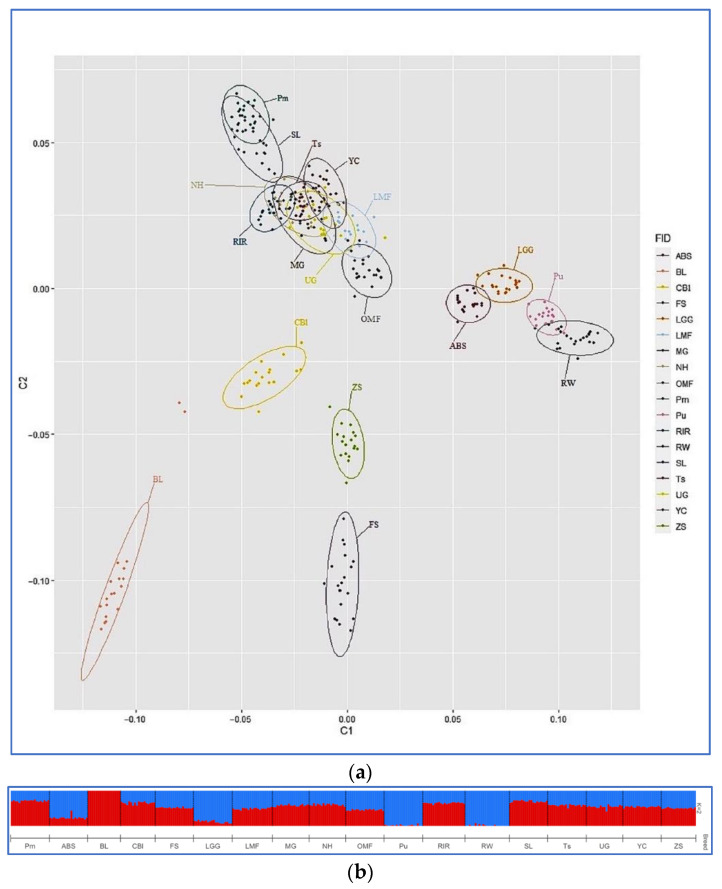
Figure 4.
Visualization of the MDS and ADMIXTURE hierarchical clustering based on genotyping information (356 individuals from 18 breeds genotyped for 38,711 SNPs). (a) Results of the MDS analysis. Individuals are plotted on the two coordinate axes, C1 and C2, according to their coordinates. Ellipses describe how each breed is dispersed around its center of gravity. (b) ADMIXTURE hierarchical clustering analysis for K = 2 predefined clusters (ancestral populations). The proportions of each cluster (y-axis) that were defined to be indicative of European (egg-type) and Asiatic (meat-type) ancestries (according to [62]) are plotted in blue and red, respectively, for each individual. Breeds: Pervomai (Pm), Australorp Black Speckled (ABS), Brahma Light (BL), Cochin Blue (CBl), Faverolles Salmon (FS), Leningrad Golden-and-gray (LGG), Leningrad Mille Fleur (LMF), Moscow Game (MG), New Hampshire (NH), Orloff Mille Fleur (OMF), Pushkin (Pu), Rhode Island Red (RIR), Russian White (RW), Sussex Light (SL), Tsarskoye Selo (Ts), Uzbek Game (UG), Yurlov Crower (YC), and Zagorsk Salmon (ZS).

