
Figure 2:
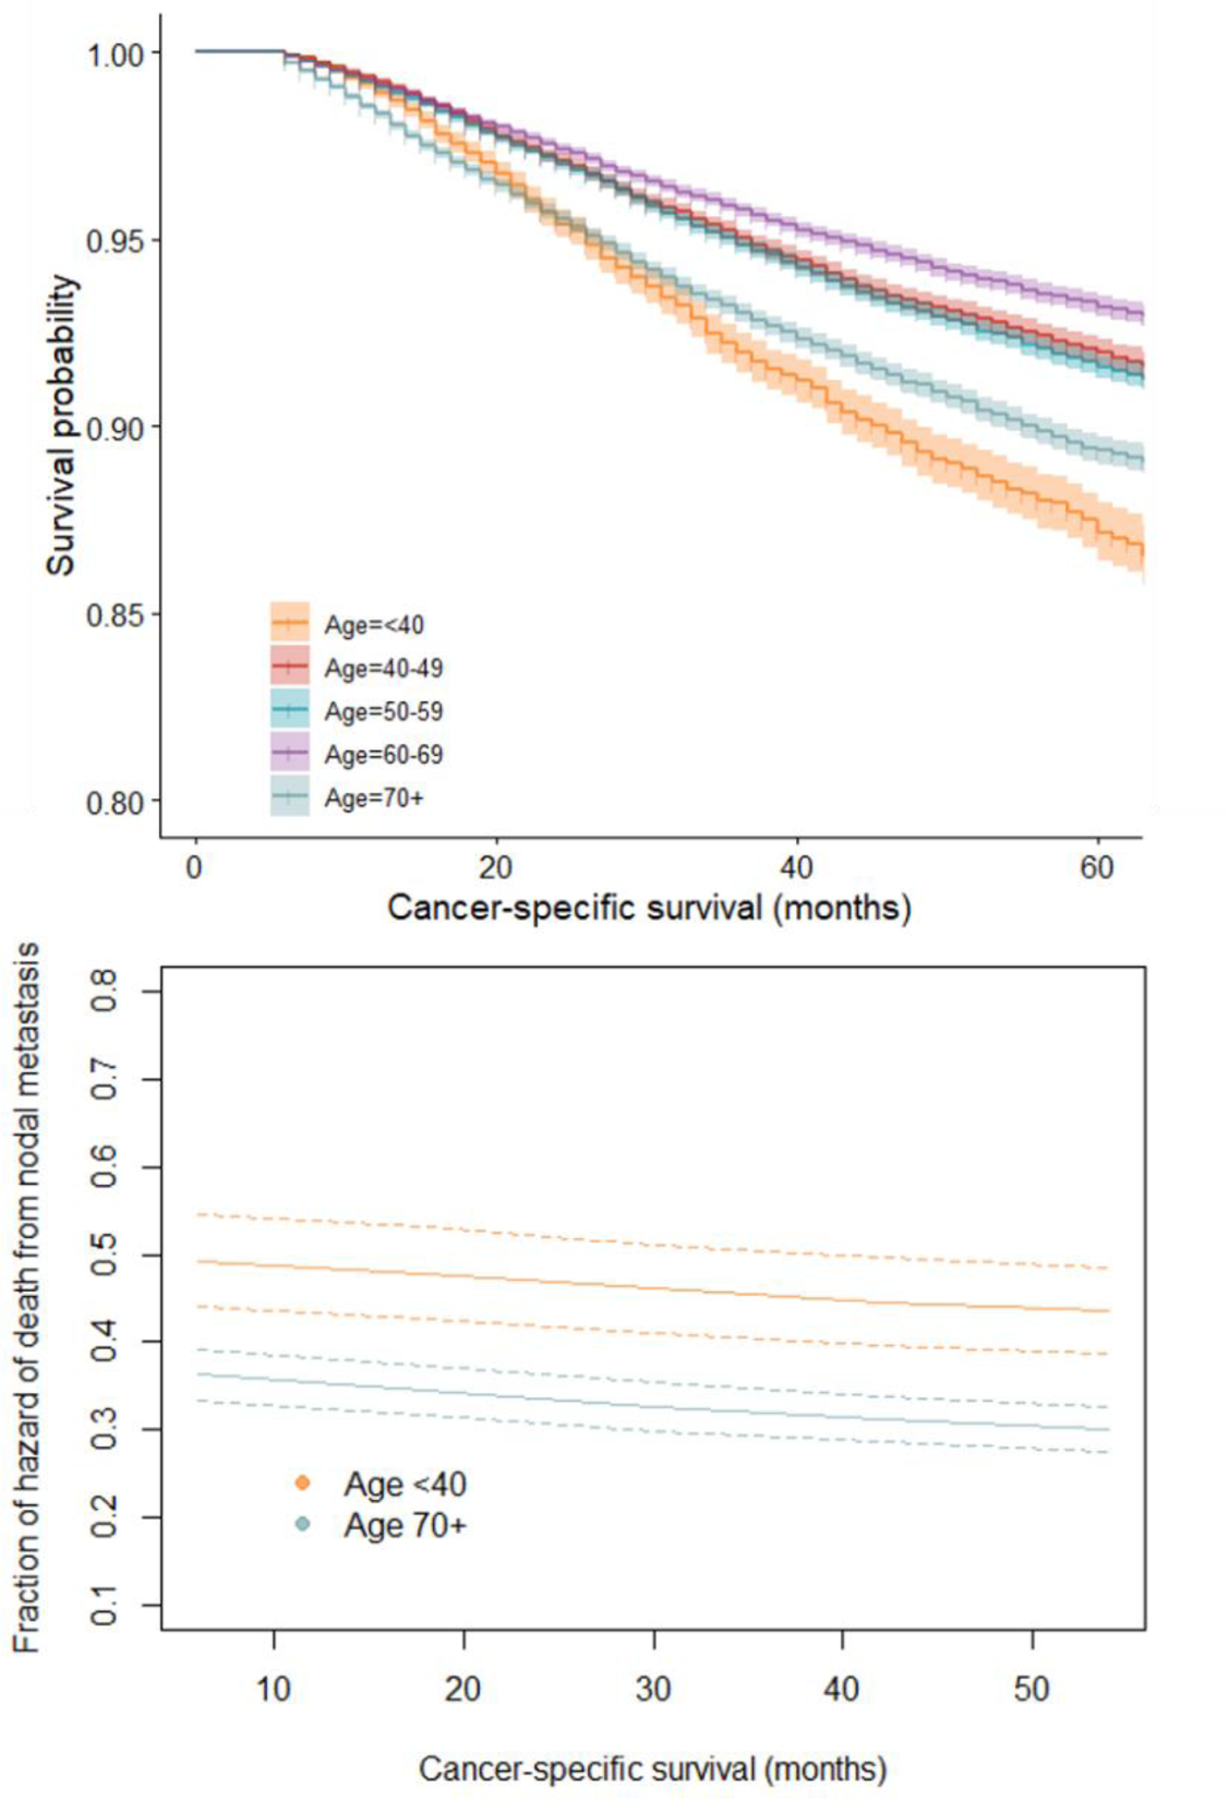
Univariate survival and NM-attributable fraction from adjusted models by selected age groups. A) Kaplan-Meier plot of survival by age group, SEER 2010–2017; B) Fraction of hazard of death due to NM for women under 40 years, and for women 70 years or more, SEER 2010–2017