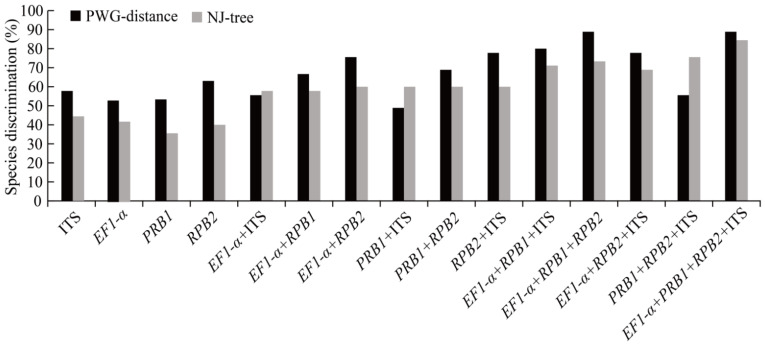
Figure 3.
Statistics of species discrimination rates based on PWG-distance and NJ-tree methods. Histograms of the frequencies (y-axes) of the species discrimination rate based on PWG-distance and tree-building; x-axes represent 4 single- and 11 multi-locus barcodes in Morchella. The black bars express the resolution rate based on the PWG-distance approach, and the gray bars show the recognition power according to tree-building method.

