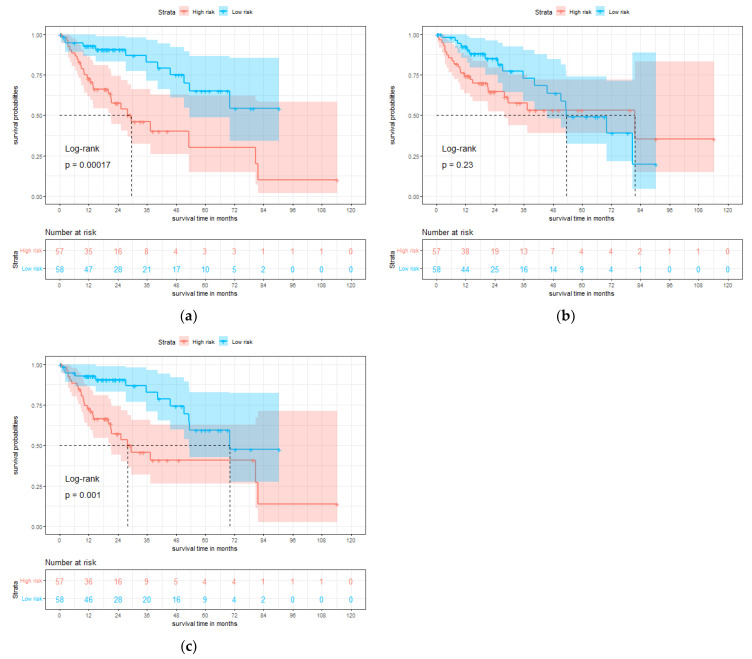
Figure 4.
Single-modality and multi-modality models were tested on the test set for hepatocellular carcinoma (HCC). (a) Kaplan-Meier (KM) curves of overall survival with the prediction of pathology prognosis model (p = 0.00017, two-sided log-rank test). (b) KM curves of overall survival with the prediction of gene prognosis model (p = 0.23, two-sided log-rank test). (c) KM curves of overall survival with the prediction of multi-modality prognosis model (p = 0.001, two-sided log-rank test). Red and blue plots represent high-risk and low-risk groups, respectively.

