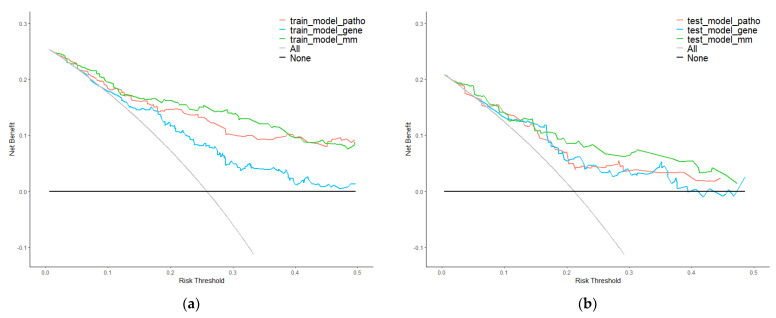
Figure 6.
Decision curve analysis (DCA) of single−modality and multi−modality models. (a) DCA for models of survival prediction on the training set. (b) DCA for models of survival prediction on the test set. Red, blue, and green plots represent pathology, gene, and multi−modality modes. Grey and black plots are two net benefit reference lines in an extreme situation.

