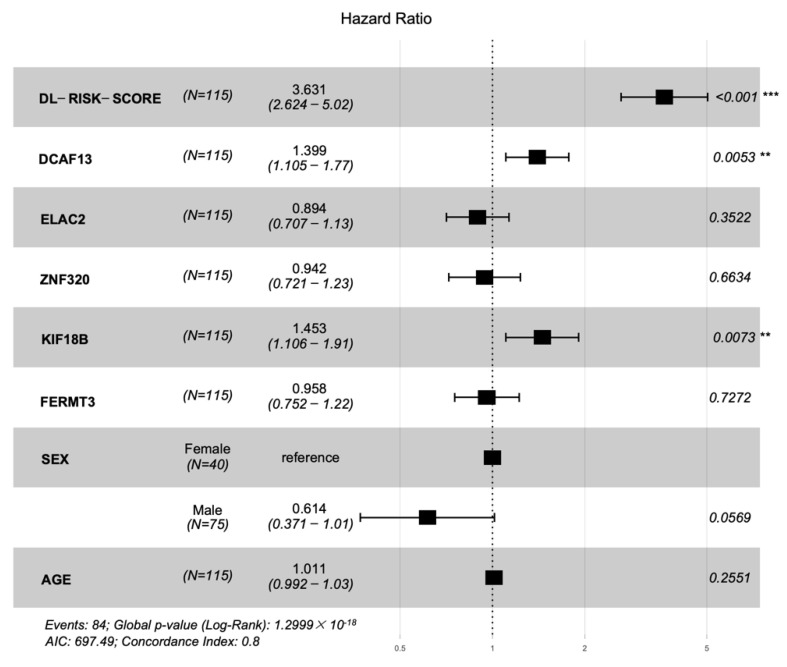
Figure 7.
Forest plot of the hazard ratios with 95% confidence intervals (CIs) and p-values obtained from the multi−modality model including the deep learning risk score, hub genes, and clinical characteristics of the cohort. The ‘***’ indicated p-value < 0.001, and the ‘**’ indicated p-value < 0.01.

