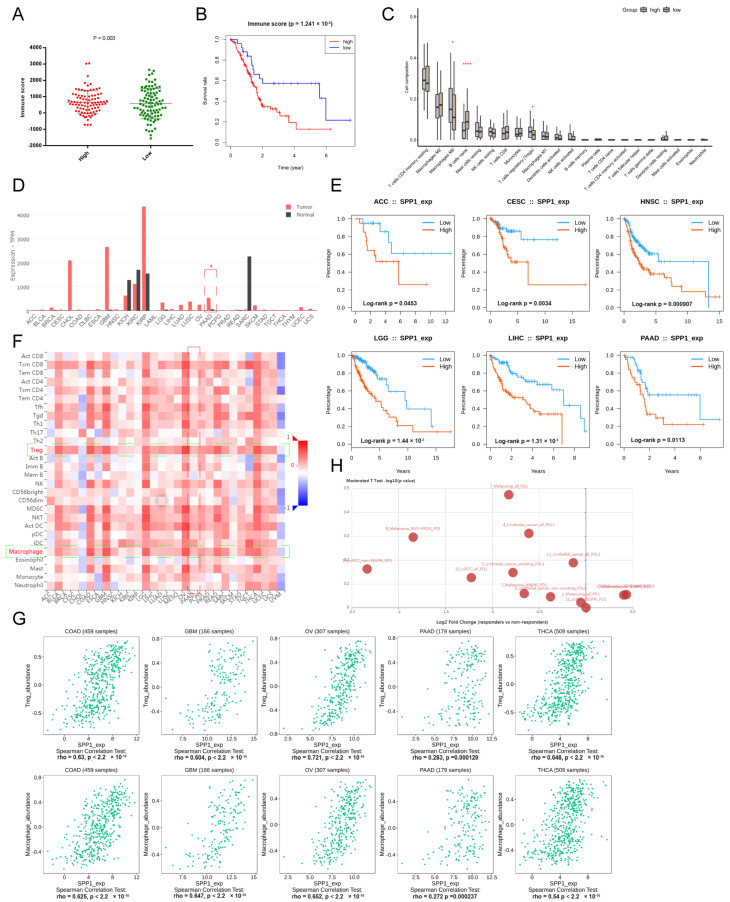
Figure 3.
The landscape of key signature–SPP1. (A) The different immune scores between high- and low-risk groups; (B) KM curve showing the OS of patients between the high- and low-immune score groups; (C) the immune cell composition of high- and low-risk groups are shown in box plots. *, **** represent p < 0.05 and 0.0001; (D) the expression level of SPP1 among various tumors (red bars represent a tumor and black bars represent normal tissues); (E) KM curves showing the prognostic value of SPP1 among various tumors; (F) the heatmap showing the correlation of the expression of SPP1 and immune cell subpopulations, targeted cell types were labeled with green frame; (G) the scatter plots showing the relationship between the expression of SPP1 and Tregs and macrophages among various tumors; (H) the expression of SPP1 between responders and non-responders in various checkpoint blockade therapy datasets.

