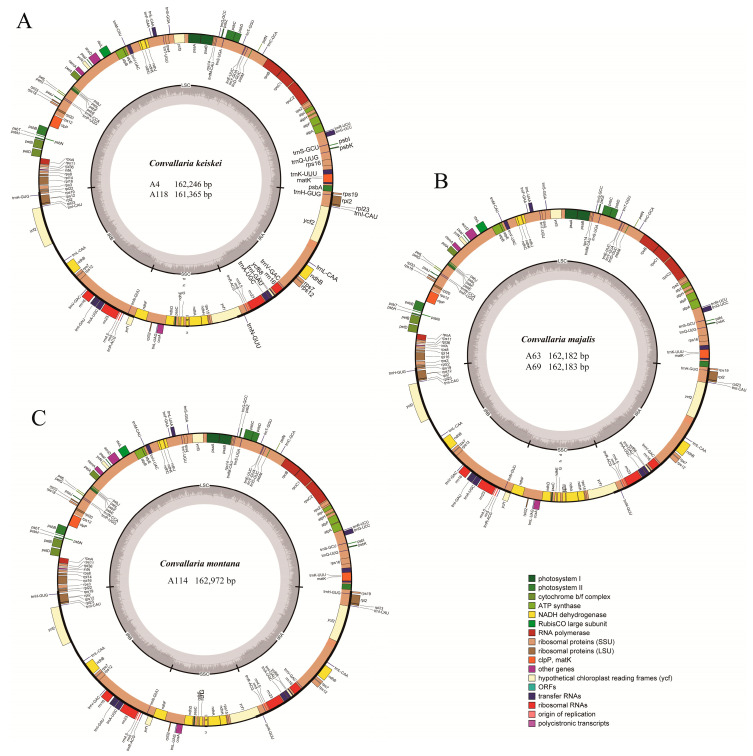
Figure 1.
Gene maps of the five Convallaria chloroplast genomes. (A) Two C. keiskei individuals; (B) two C. majalis individuals; (C) one C. montana individual. Different color indicates different functional gene groups. The dark gray in the inner represents GC content, and the light gray represents AT content.

