
Figure 1.
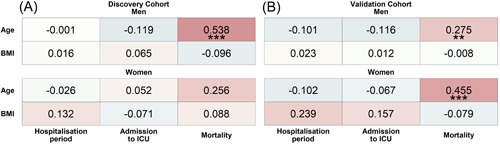
Association‐heatmap of age and BMI with hospitalization period, ICU admission, and mortality. Shown is a heatmap representation of Spearman's correlation coefficients and their significance for associations between patient characteristics of the discovery (A) and validation (B) cohort stratified by sex. Correlations are highlighted in color, with red representing a positive correlation and blue a negative correlation. Color intensity indicates Spearman's correlation coefficients (r). BMI, body mass index; ICU, intensive care unit. **p < .01; ***p < .001. DiscoveryWomen = 51, DiscoveryMen = 97, ValidationWomen = 56, and ValidationMen = 128.