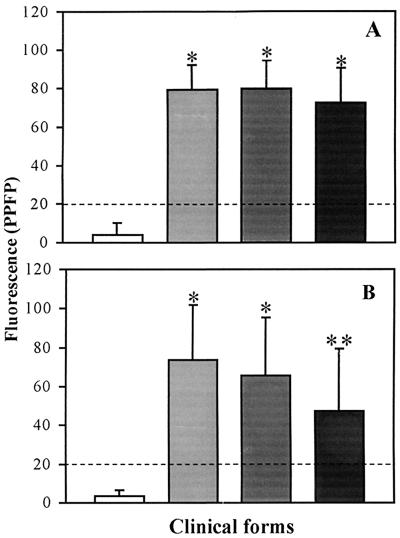
FIG. 4.
IgG1 (A) and IgG2 (B) reactivity anti-fixed T. cruzi EPI in individual serum samples from chagasic patients (IND, n = 20 [light shaded bars]; CARD, n = 27 [dark shaded bars]; DIG, n = 29 [black bars]) and nonchagasic individuals (NC, n = 20 [white bars]). The individual serum was used at a dilution of 1:256 for IgG1 and 1:128 for IgG2. The fluorescence is expressed as PPFP. The dotted line represents the cutoff between negative and positive PPFPs. ∗, P ≤ 0.05 in comparison to NC; ∗∗, P ≤ 0.05 in comparison to NC, IND, and CARD.

