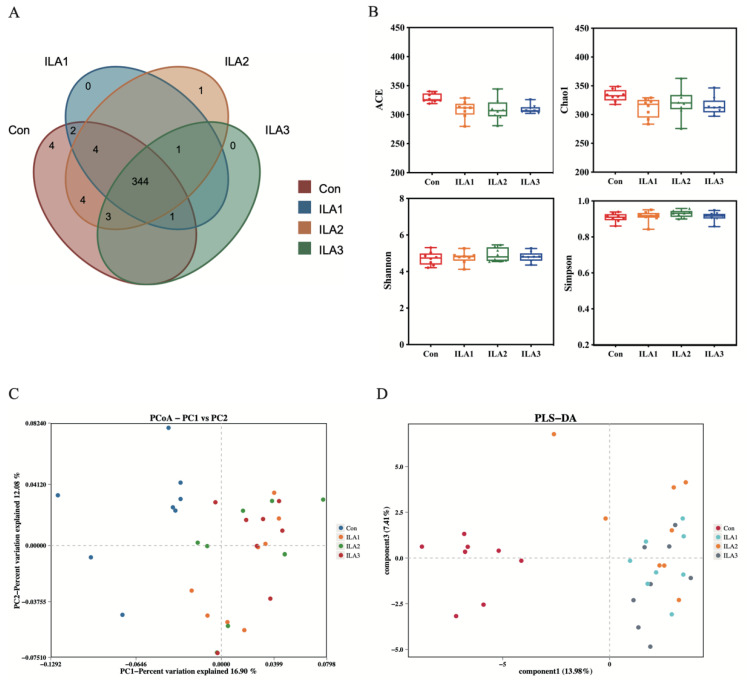
Figure 2.
Alpha diversity and beta diversity analysis of bacterial communities in fecal fermentation samples. (A) Venn diagram of microbial compositions on OTU level. (B) Alpha diversity including the ACE, Chao1, Shannon and Simpson indexes based on OTU level. There were no significant differences in the microbial richness and diversity between the Con and ILA groups (p > 0.05). (C) PCoA plots at genus level based on unweighted UniFrac analysis. (D) PLS-DA plots at genus level based on unweighted UniFrac analysis.

