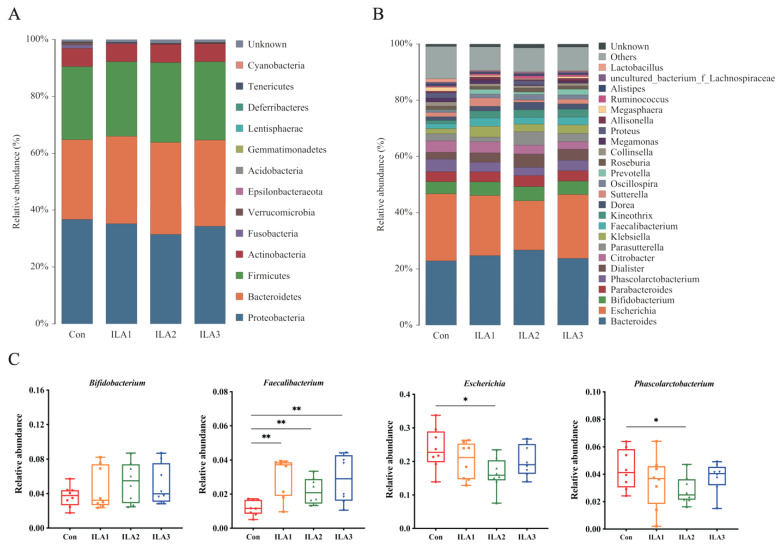
Figure 3.
Changes in the relative abundances of bacterial communities. (A) Distribution of the predominant bacteria at the phylum level. (B) Distribution of the predominant bacteria at the genus level. (C) Compositional alterations of genera Bifidobacterium, Faecalibacterium, Escherichia and Phascolarctobacterium. Differences between Con group and each ILA group were analyzed by Student’s t-test. *, p < 0.05; **, p < 0.01.

