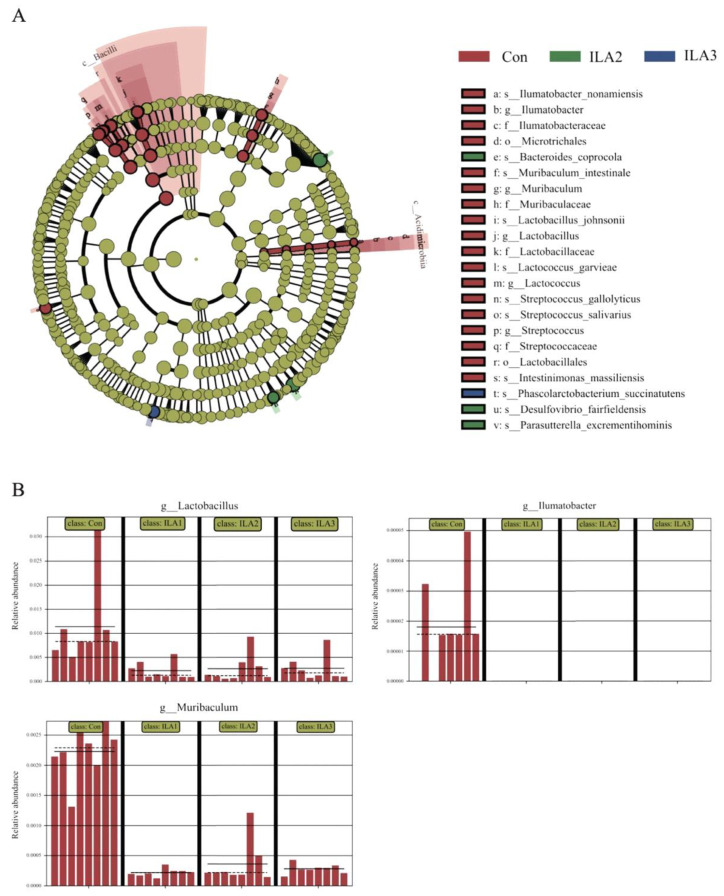
Figure 4.
Differentially abundant taxa of gut microbiota by LEfSe analysis. (A) Most abundant taxa from the phylum to the species level in fermented feces samples. Only taxa with an LDA score greater than 3.0 are shown. (B) Relative abundance of Lactilactobacillus, Muribaculum and Ilumatobacter in each sample.

