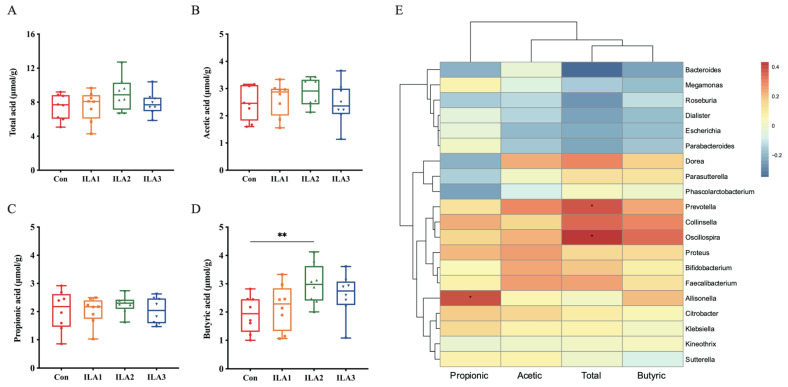
Figure 5.
The content of SCFAs in fecal samples and the correlation analysis between SCFAs and microbiota. (A–D) Changes of SCFA contents included total acid, acetic acid, propionic acid and butyric acid in fecal samples. Differences between Con group and ILA group were analyzed by Student’s t-test. **, p < 0.01. (E) Heatmap of the relative abundance of gut microbiota and main SCFAs by Pearson. *, p < 0.05.

