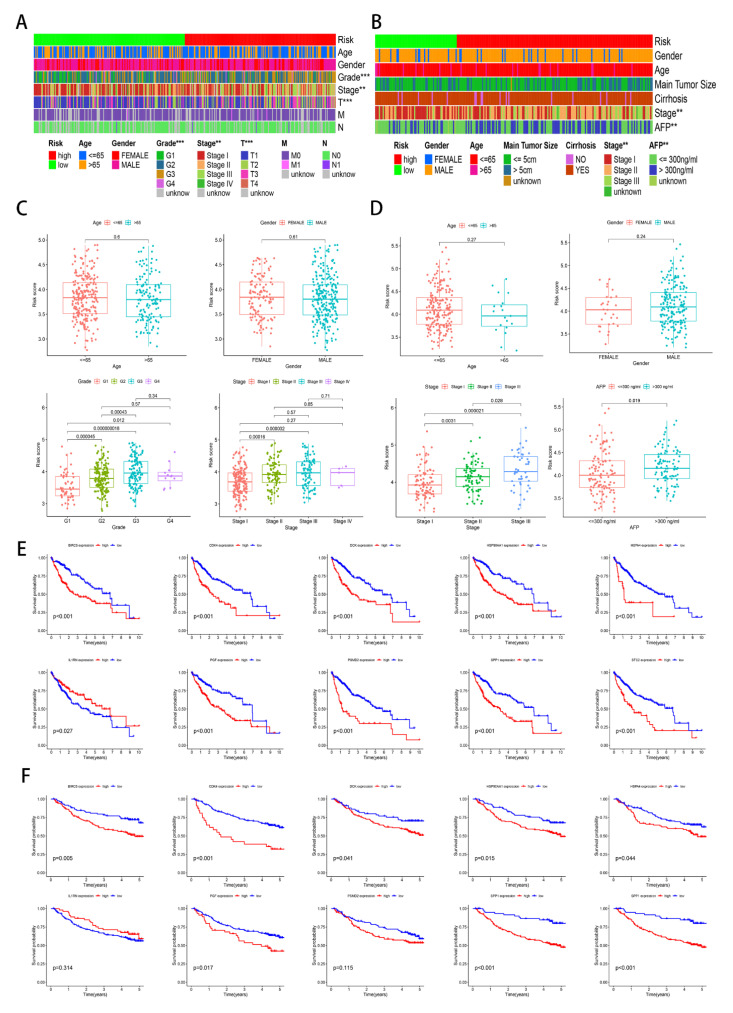
Figure 4.
Clinical feature analysis and survival analysis. ** p < 0.01; *** p < 0.001. (A) Heatmap of the clinical correlation in the TCGA cohort. (B) Heatmap of the clinical correlation in the GSE14520 cohort. (C) Box plot of the clinical correlation in the TCGA cohort. (D) Box plot of the clinical correlation in the GSE14520 cohort. (E) The OS of the ten genes in the TCGA cohort. (F) The OS of ten genes in the GSE14520 cohort.

