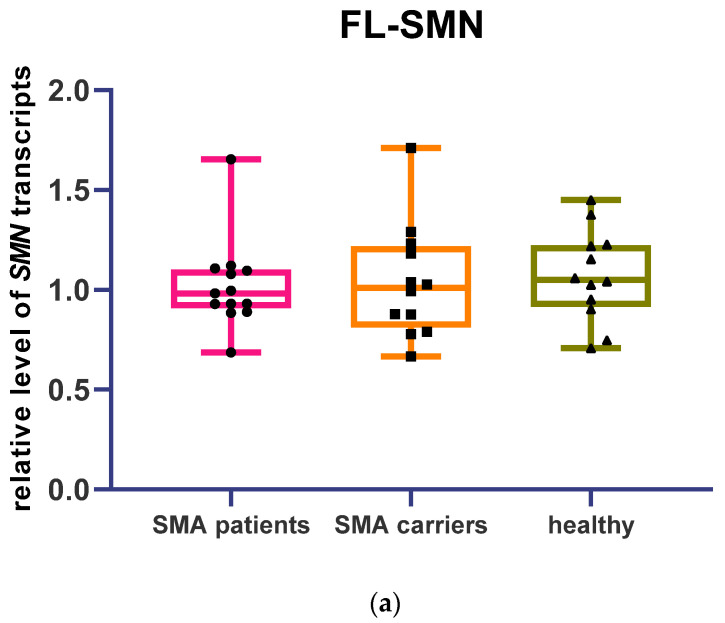
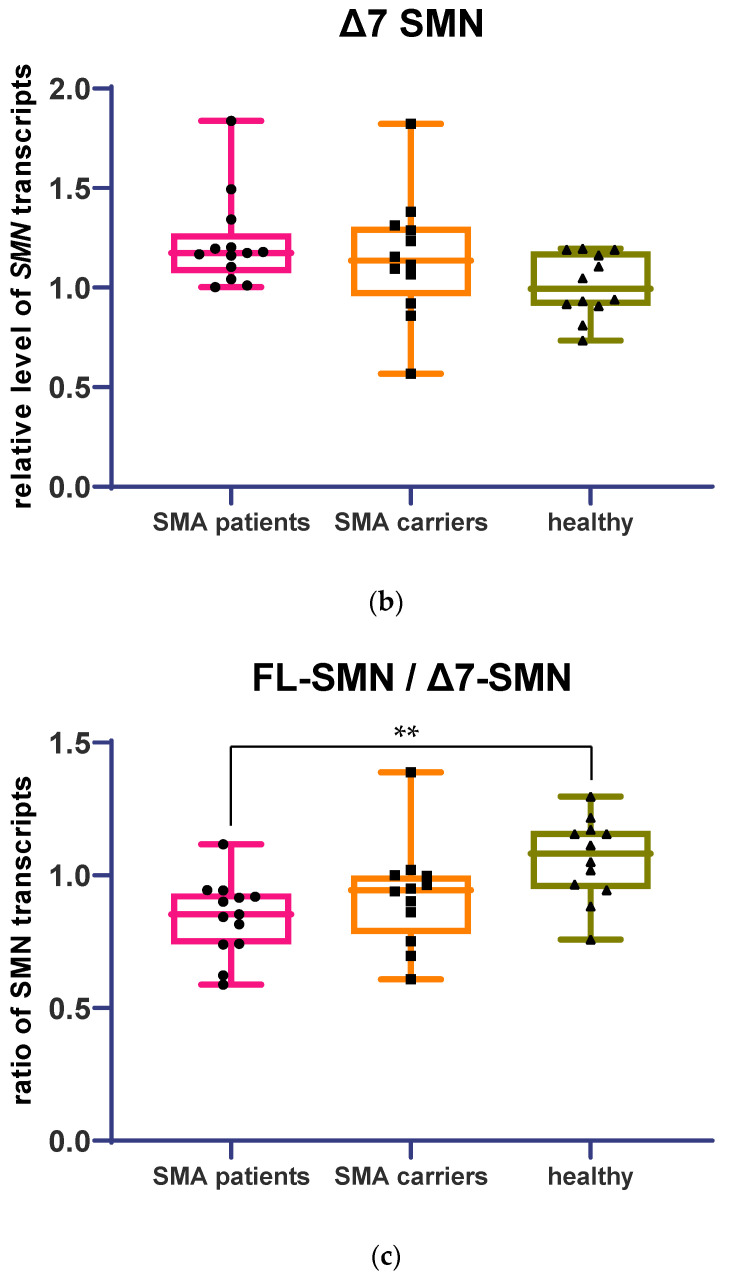
Figure 1.
Level of full-length and Δ7 SMN transcripts relative to H3B and GAPDH transcripts obtained by real-time PCR in SMA patients’ (a), SMA carriers’ (b), and healthy individuals’ blood cells (c). Ratio of FL to Δ7 SMN transcripts (significantly higher in healthy individuals’ cells compared to SMA patients’ cells, **-p < 0.01 determined by Kruskal–Wallis test with Dunn’s follow-up test).


