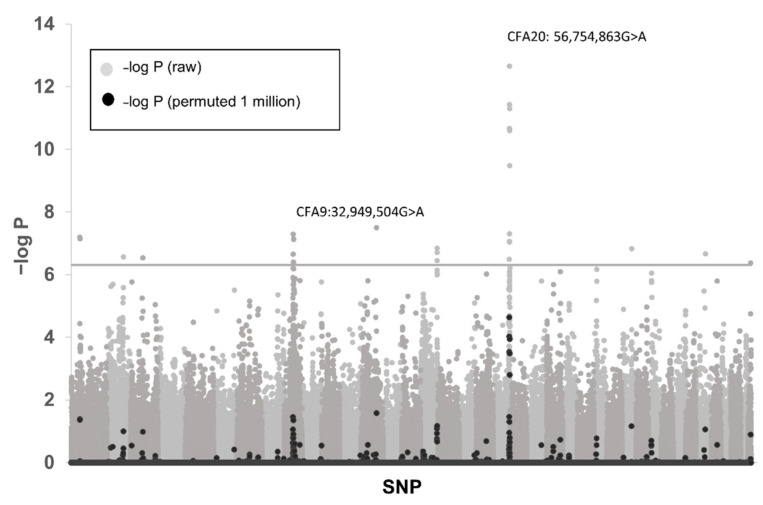
Figure 1.
Manhattan plot of genome-wide association with 45 CA affected kelpies and 290 controls. Negative log of raw CHI-squared probabilities is shown in grey, and permuted (1 million permutations) values are shown in black. The most significant associations were identified on CFA20 and CFA9 corresponding with two different disease phenotypes in the data. The notional cut-off for significance (Praw) is indicated by a grey line (−log P = 6.3).

