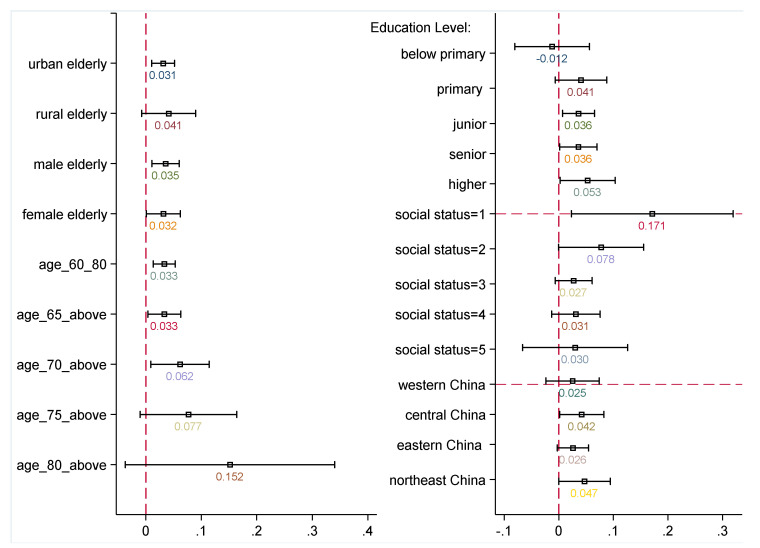
Figure 2.
Heterogeneous effects of OSIs on older Chinese adults’ life satisfaction according to gender, residential status, age span, social status, education, and geographical area. Note: Other controls are the same as Table 2, and regressions of social status groups are not controlled for social status. Estimates of OSIs are reported in the figure with 95% confidence intervals. The regressions’ detailed results are presented in Table A1 and Table A2 in Appendix A.

