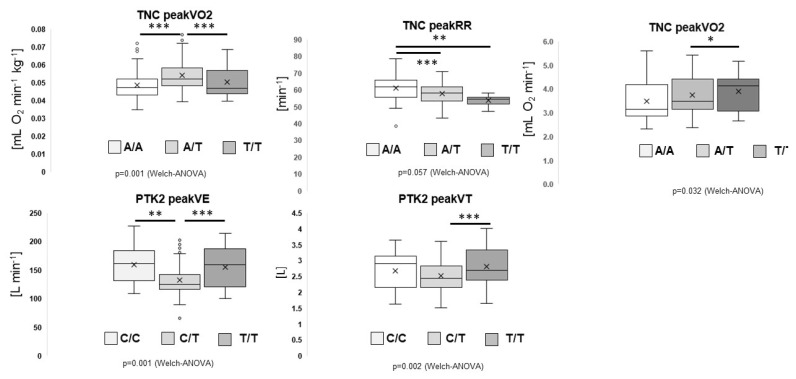
Figure 4.
Main genotype associations with cardiorespiratory parameters. Box-whisker plots for absolute and body-mass-related peak VO2 and peakRR for TNC (rs2104772) genotypes and peakVE and peakVT for PTK2 (rs7843014) genotypes. ANOVA with post hoc test of least significant difference. The corresponding p-values for the Welch type ANOVA are indicated below each panel. *, ** and *** indicate, p ≤ 0.05, 0.01 and 0.001, respectively, for the indicated comparisons.

