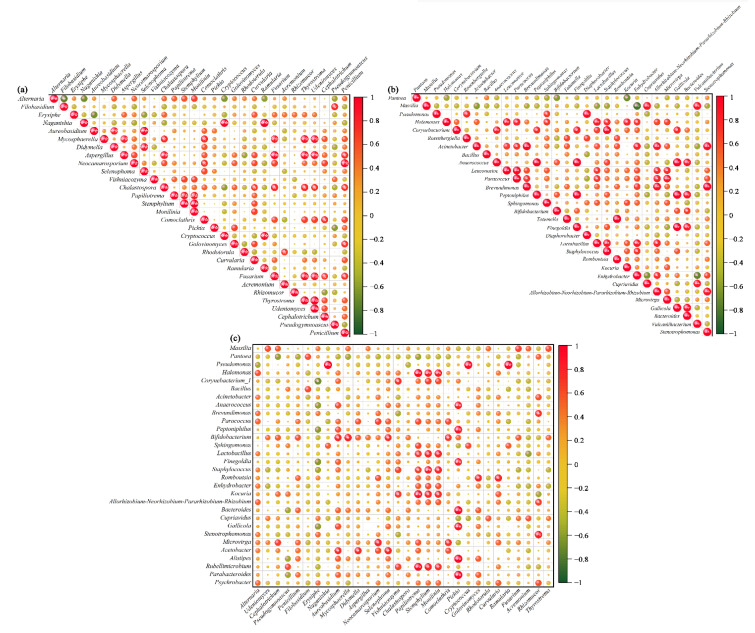
Figure 8.
Co-occurrence and co-exclusion relationships between different bacteria (a) and fungi (b) and between bacteria and fungi (c). The Pearson rank correlation matrix showing the abundances of the top 30 fungi and bacterial genera is depicted. Strong and weak correlations are indicated by the large and small circles, respectively. The color of the scale bar denotes the nature of the correlation; 1 indicates a perfect positive correlation (red) and −1 indicates a perfect negative correlation (green). Significant correlations (|r| > 0.7, p < 0.01) and (|r| > 0.9, p < 0.01) are indicated by * and **, respectively.

