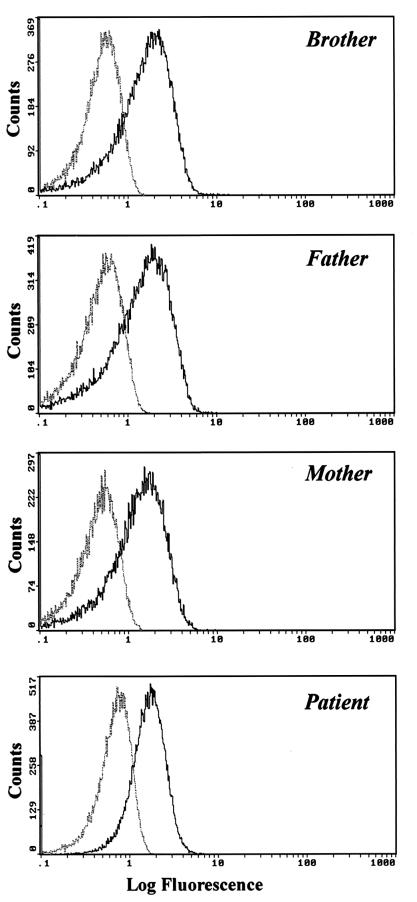
FIG. 2.
Cytofluorographic analysis of CD119 expression in the patient and family. Dotted lines, isotypic control fluorescence; solid lines, positive fluorescence. The graph shows expression in peripheral blood lymphocytes; similar results were obtained in peripheral monocytes and granulocytes (data not shown).

