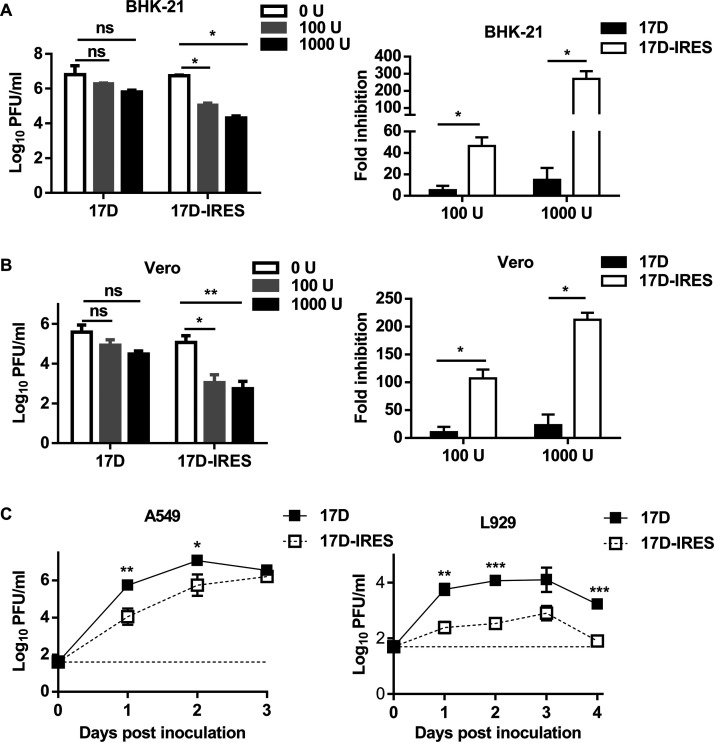
FIG 4.
17D-IRES shows increased sensitivity to IFN. An IFN sensitivity assay was performed on BHK-21 (A) and Vero cells (B). Cells were treated with media containing different concentrations of IFN-αA/D (0, 100, or 1,000 U/mL). The treated cells were washed with PBS and infected with 17D or 17D-IRES at an MOI of 1. At 24 h postinfection, the supernatants were collected, and the virus titers were determined by plaque assay in BHK-21 cells. The fold changes of the virus titers were also calculated (right). (C) Growth curves of 17D and 17D-IRES on A549 (left) and L929 (right) cells. Monolayers of A549 and L929 cells were infected with the indicated viruses at an MOI of 0.01. The cell supernatants were collected at the indicated times for the determination of the virus titers by plaque assay using BHK-21 cells. Data represent the means and SD of three independent experiments. Viral titer data were measured via unpaired t test. n.s., not significant; *, P < 0.05; **, P < 0.01.

