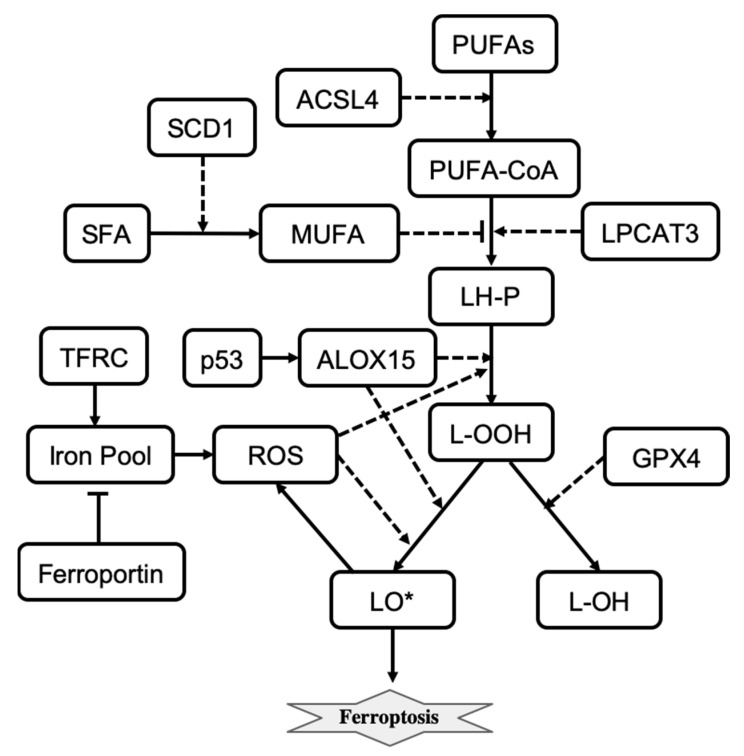
Figure 4.
The influence diagram shows key molecular components involved in ferroptosis regulation. Solid arrows represent reactions of transformation, activation (arrowhead), and inhibition (bar head). Dashed lines with arrowheads or bar heads represent activation or inhibition of a reaction, respectively.

