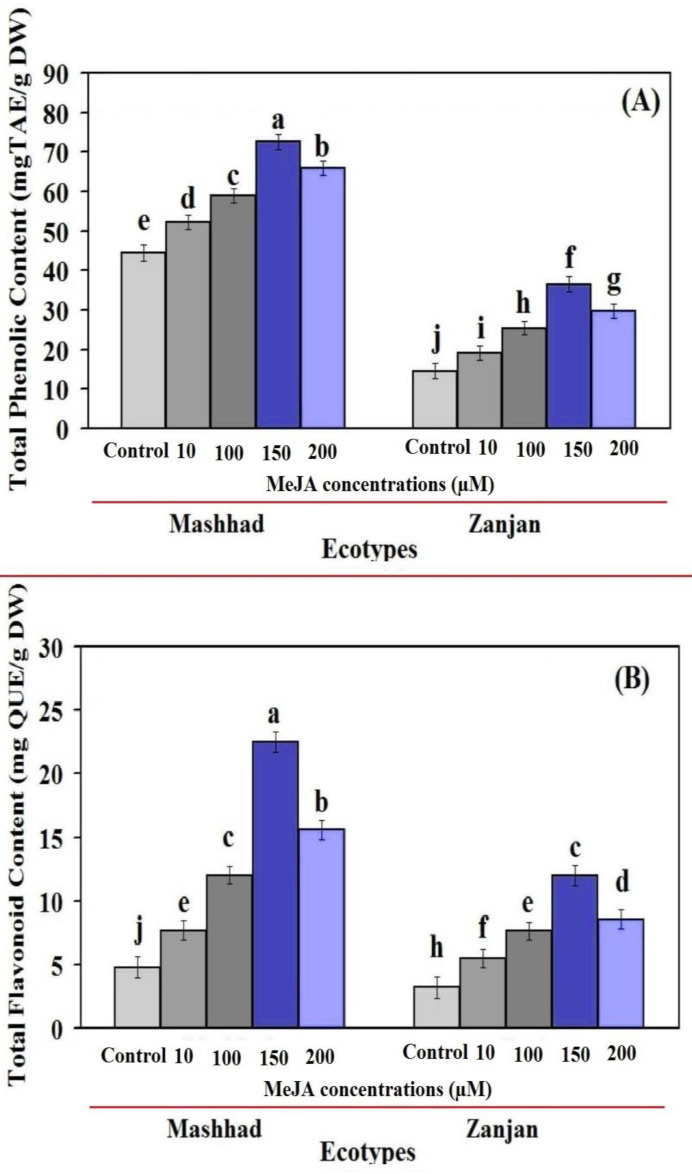
Figure 3.
The impact of various MeJA concentrations on the TPC (A) and TFC (B) of leaf extracts from two Iranian coriander ecotypes. The data are shown as mean standard deviations (n = 3). According to Duncan’s test, distinct letters in each column indicate significance at a 1% level of probability. Error bars are shown in percent of standard deviation.

