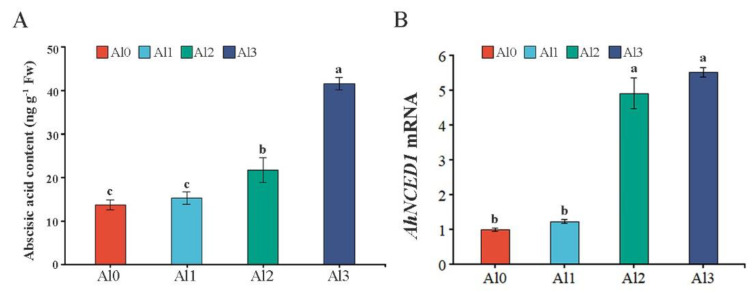
Figure 5.
Effect of different Al3+ concentrations on the ABA content and AhNCED1 transcript levels. The effect of Al treatments on ABA content (A). qRT-PCR analysis of relative transcription levels of AhNCED1 (B). Al0, Al1, Al2, and Al3 represent 0 (pH 6.85), 1.25 (pH 4.03), 2.5 (pH 3.85), and 5 (pH 3.69) mmol/L AlCl3.18H2O solutions, respectively. Data are means (±SE), n = 3. Marking the same letters means p ≥ 0.05 (LSD), there is no significant difference, the difference between different letters means p < 0.05 (LSD), and the difference is significant.

