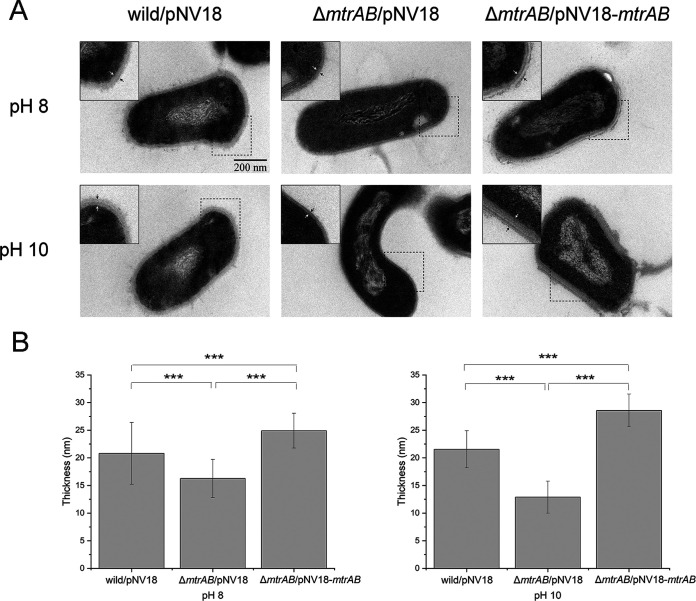
FIG 3.
Ultrastructure of the cell envelope of Dietzia cells. (A) Representative thin-section transmission electron microscopy of the Dietzia sp. DQ12-45-1b wild-type strain, the ΔmtrAB mutant, and complementary strain cells under different pH conditions. The distance between two arrows represents the thickness of the cell envelope. Insets show small portions of cell cross sections for each image. (B) Histogram of cell envelope thickness measurements obtained by analyzing ~10 cells/sample in transmission electron microscopic cross sections from panel A. Every cross-section selected multiple regions for measurement using Digimizer (unpaired t test for panel B; ***, P < 0.001).

