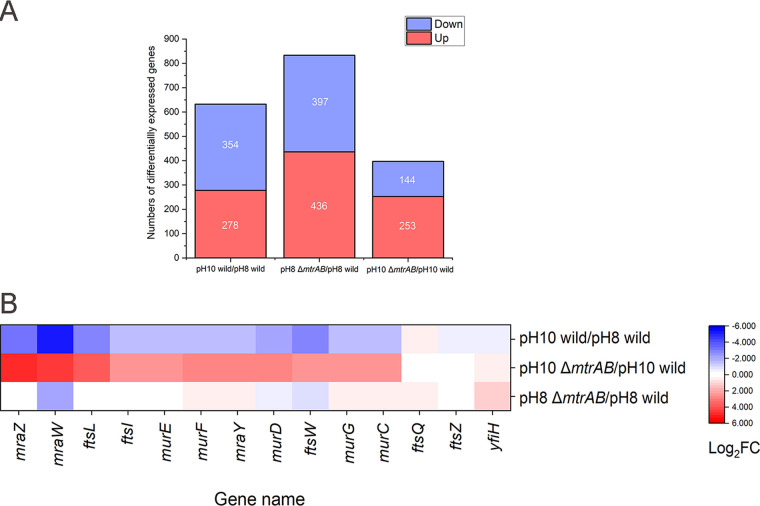
FIG 4.
Transcriptomic analysis of the dcw cluster wild-type and ΔmtrAB mutant strains at pH 8 and pH 10. (A) Stacked columns of the number of DEGs (fold change ≥ 2, FDR ≤ 0.05). (B) Heatmap of the dcw cluster induced and repressed in wild-type and ΔmtrAB mutant strains under different pH conditions. Red represents upregulated genes, and blue represents downregulated genes.

