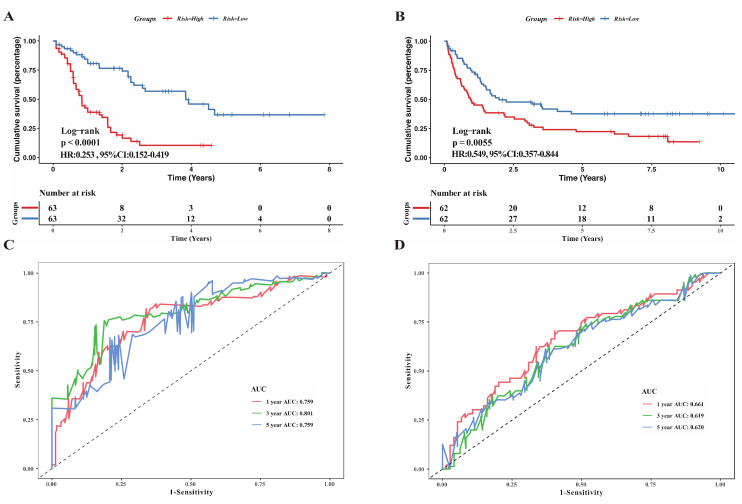
Figure 3.
Assessment of ability of the risk signature to predict prognostic in both training and validation cohorts. (A,B) Kaplan-Meier survival curves reveal the difference of prognostic in two risk subgroups in TCGA cohort (A) and GSE37642 cohort (B). (C,D) ROC curves showing the predictive power of the risk model on the survival rate in TCGA cohort (C) and GSE37642 cohort (D).

