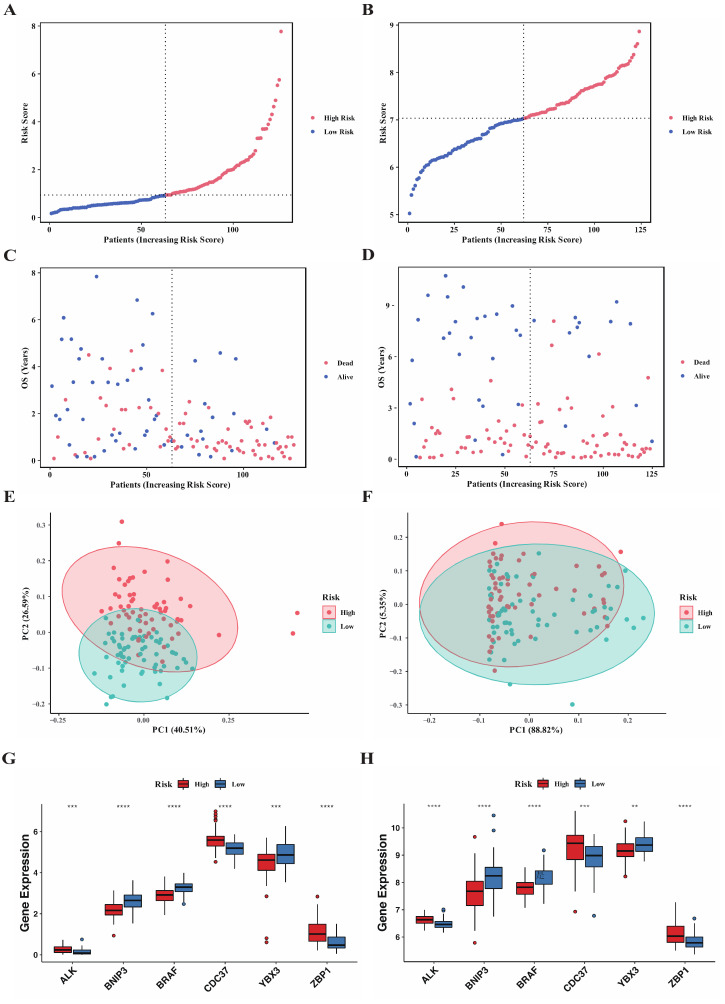
Figure 4.
Two risk subgroups generated based on the median risk score. (A–D) Distribution of risk score, survival time and survival status for AML patients in TCGA cohort (A,C) and GSE37642 cohort (B,D). (E,F) Principal component analysis of the risk score to distinguish the two subgroups in TCGA cohort (E) and GSE37642 cohort (F). (G,H) Comparison of the expression of 6 genes in the risk model between the two subgroups in TCGA cohort (G) and GSE37642 cohort (H). (Wilcox test, ** p < 0.01; *** p < 0.001, **** p < 0.0005).

