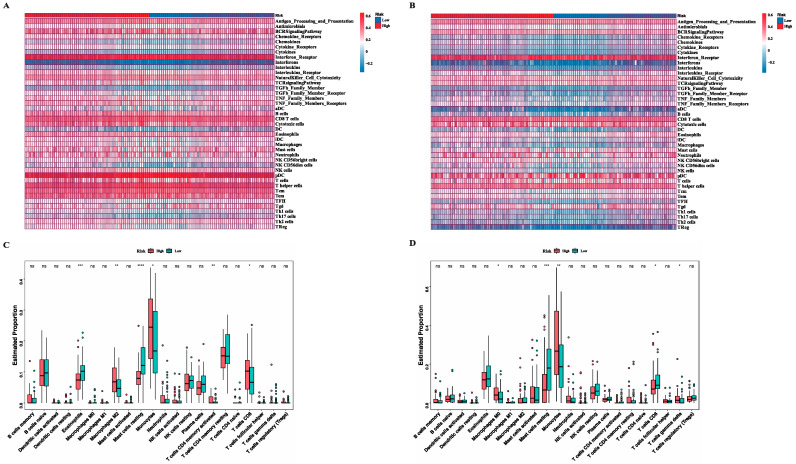
Figure 7.
Landscape of immune activity and relevant infiltrating immune cells in the two risk subgroups. (A,B) Heatmap showing the ssGSEA enrichment scores of 40 immune components including immune cells, relative immune factors and pathways in TCGA (A) and GSE37642 (B) cohorts. (C,D) Comparisons of proportion of 22 immune cells between the two risk subgroups in TCGA (C) and GSE37642 (D) cohorts (Wilcox text, * p < 0.05; ** p < 0.01; *** p < 0.001, **** p < 0.0005).

