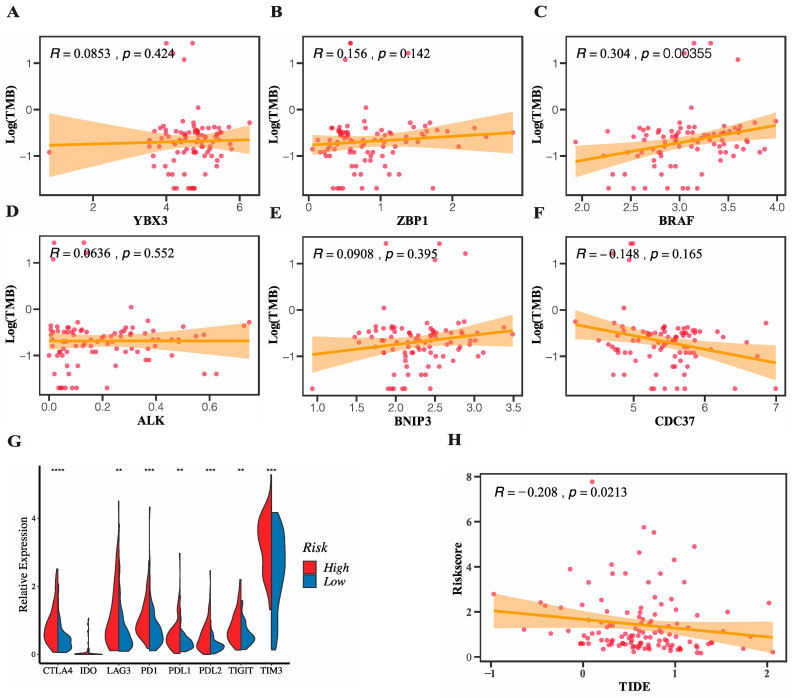
Figure 8.
Evaluation of potential value of the risk model in the ICB immunotherapy in TCGA cohort. (A–F) Correlation of the 6 genes in the signature with TMB. (G) Differences of expression profiles of common checkpoint genes in the two risk subgroups (Wilcox text, ** p < 0.01; *** p < 0.001, **** p < 0.0005). (H) Correlation between the risk score and TIDE score (Spearman test, p < 0.05).

