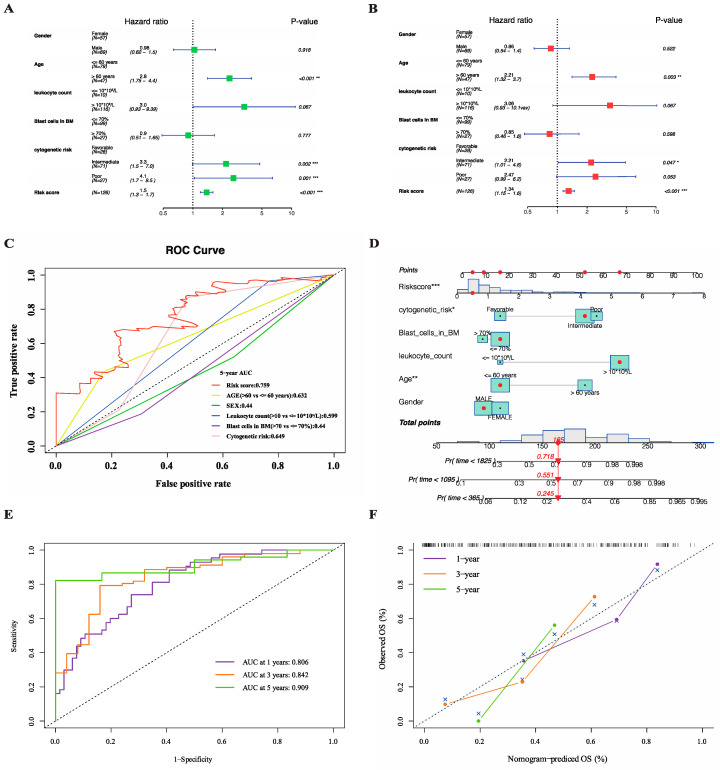
Figure 9.
Construction of the OS-predictive nomogram for clinical application in TCGA cohort. (A,B) Univariate (A) and multivariate (B) Cox regression analysis of the risk signature to verify its independent predictive efficacy of OS. (C) ROC curves for the risk score and major clinical features including gender, age, white blood cell (WBC) count, blast cells percentage in bone marrow (BM) and cytogenetic risk. (D) Nomogram based on the combination of clinical features and risk score predicting 1-year, 3-year and 5-year survival. (E) ROC curves showing the predictive power of nomogram. (F) Calibration plot showing the predictive reliability of nomogram. p values are showed as: * p < 0.05; ** p < 0.01; *** p < 0.001.

