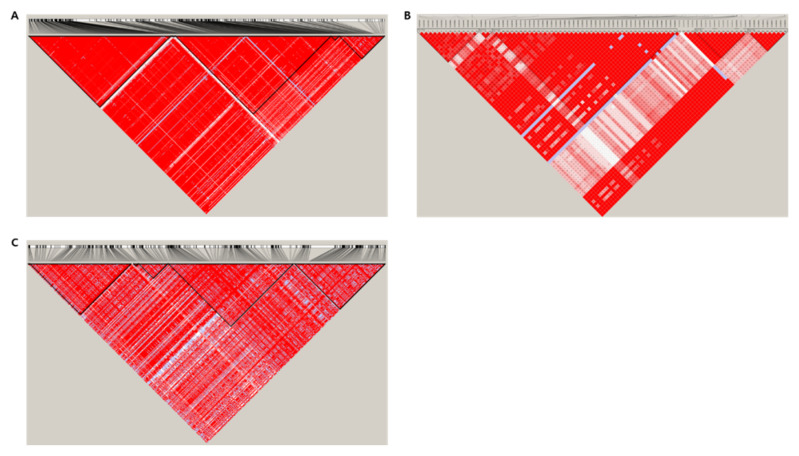
Figure 5.
Linkage disequilibrium (LD) plot generated using Haploview software. LD is displayed as pairwise D’ values. Each color represents the magnitude and significance of pairs LD, and the gradation from red to white is from a high LD value to a low value. Red diamonds without numbers correspond to a D’ value of 1.0. (A) S4_34033252, (B) S3_20312675, (C) S1_6459856.

