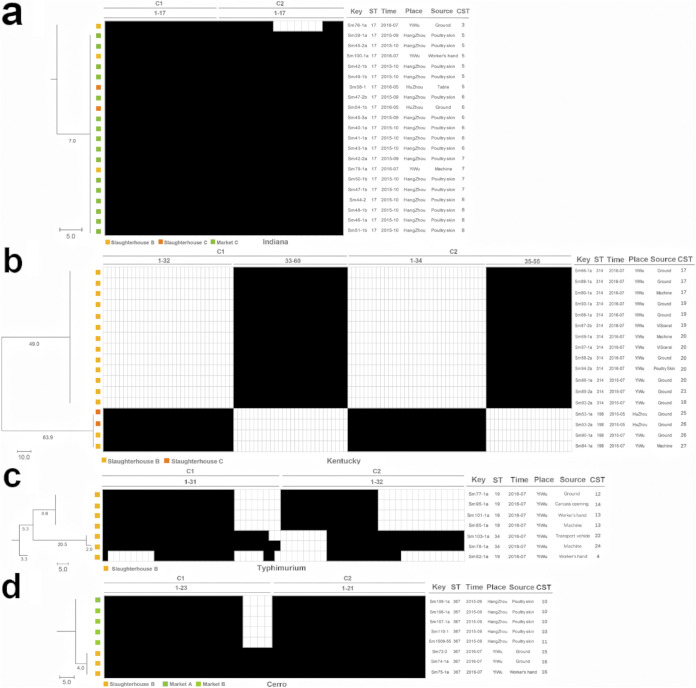
FIG 2.
CRISPR-pattern of the studied Salmonella serovars, including Indiana (a), Kentucky (b), Typhimurium (c), and Cerro (d). CRISPR cluster analysis diagram of 4 serovars: (a) Indiana, (b) Typhimurium, (c) Cerro, (d) Kentucky. These phylogenies were made to cluster isolates based on their CRISPR spacer profiles (CRISPR-patterns). Key variables and isolate information are marked around the trees and heatmap of the CRISPR-pattern matrixes: CRISPR 1 is abbreviated as C1 and CRISPR 2 as C2. The tree scale bar represents a standard distance estimated by a neighbor-joining method. Time of sample collection (time), location of sample isolation (place), CRISPR-MVLST sequence type (CST), MLST sequence type (ST). The yellow and orange color represents the isolate from slaughterhouses A and B, respectively. The dark green, light green and standard green color represent the isolate from market A, B and C, respectively. In the CRISPR-pattern heatmap, each square represents a spacer sequence and those marked in black indicates the presence of the spacer in that isolate, while remaining blank indicates the absence of the spacer. Due to the excessive number of spacers, they are marked and labeled with numbers on the diagram for convenience. Take (b) as an example, 1-32 means spacers of C1 from the 1st to the 32nd; 1-55 means all the spacers of C2 from the first to the end. A line is drawn to segregate the necessary section and facilitate locating the spacer.

