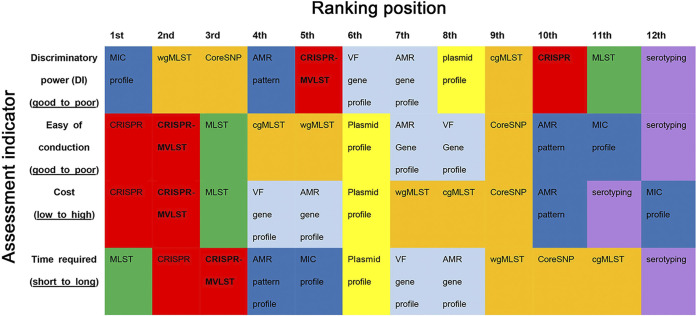
FIG 3.
A visualized ranking of 12 examined typing methods in this study. The x axis shows the ranking position for 12 methods. The y axis shows all assessment indicators for these methods. Blocks in red represent methods using spacer sequences of CRISPR loci. Blocks in orange represent methods using a relatively global loci/site at a whole-genome level. Blocks in green represent the 7-gene legacy MLST method. Blocks in deep blue represent methods based on phenotypic antimicrobial resistance (AMR) data. Blocks in light blue represent methods based on AMR or VF loci. Blocks in light blue represent methods using plasmid profiles. Blocks in purple represent methods based on the White–Kauffman serotyping scheme.

