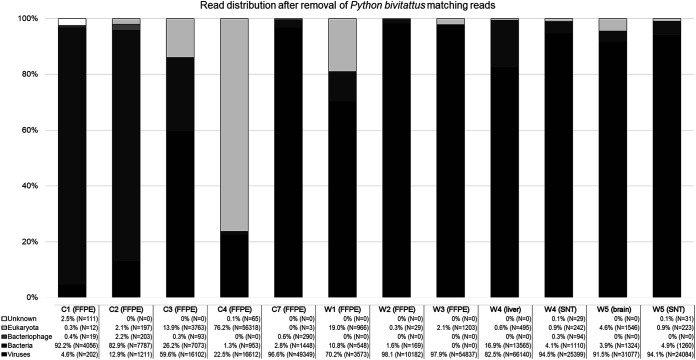
FIG 5.
The distribution of reads in Lazypipe (33) analysis after the removal of reads matching to Python bivitattus genome. The y axis represents percentage of reads. The reads matching viruses, bacteria, bacteriophages, eukaryota, and unknown (i.e., those not without match) are shown in colors ranging from black to white as indicated in bottom left corner. The number of reads matching each category are presented in written format (% of total reads of the sample and the number of reads in brackets) under each respective sample name.

