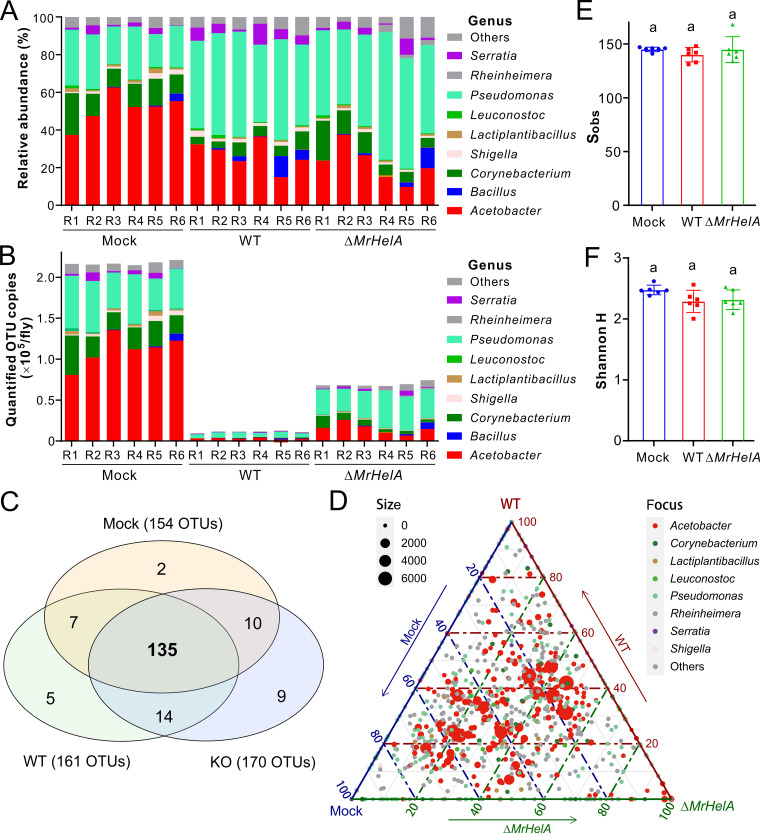
FIG 5.
Suppression of the Drosophila cuticular microbiomes by M. robertsii. (A and B) Quantitative analysis of the fly surface microbiomes showing the relative (A) and quantified (B) abundance variations between different treatments at the bacterial genus level. 3-DPE male flies were immersed in 0.05% Tween 20 (Mock) and spore suspensions of the WT and ΔMrHelA strains for 30 s. After treatment for 16 h, the flies were collected (10 per replicate) for washing off surface bacteria for 16S rRNA amplification and library sequencing. Quantification analysis was conducted based on the addition of the synthetic spike-in standard. (C) Venn diagram analysis showing the detected bacterial OTUs largely shared between treatments. (D) Ternary plot analysis showing the core bacterial taxa shared between samples. (E and F) Nonvariation of the total observed OTU numbers (Sobs) (E) and Shannon H indices (F) between treatments. One-way ANOVA was conducted, and the same letter above each column represents nonsignificant variation between samples.

