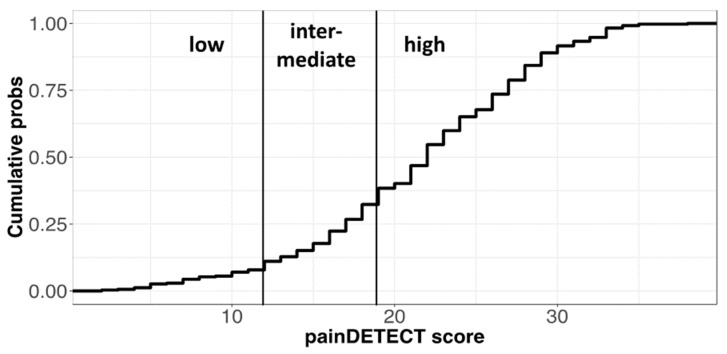
Figure 5.
Scores of the PD-Q test and related categories. (Top) Cumulative frequency of scores in the PD-Q scale with cutoffs for pain categories. The relative frequencies of pain categories in the test (low = 0.11; intermediate = 0.21; high = 0.68) are significantly different from uniform distribution according to a chi-square test (n = 344, χ-squared = 188.5, df = 2, p < 2.2 × 10⁻¹⁶).

