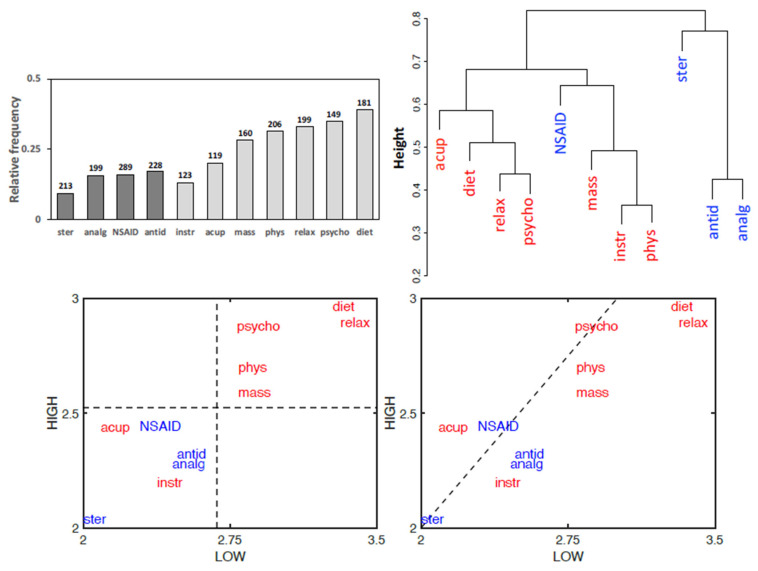
Figure 7.
Patient’s classification of the therapy efficacies. (Top left) Cumulated relative frequencies of the two highest ratings out of five (null; low; average; good; excellent). Numbers above bars indicate total valid responses. Darker bars: pharmacological treatments; lighter bars: non-pharmacological treatments. (Top right) Dendrogram generated using an average linkage agglomerative algorithm based on pairwise correlations between the effectiveness of the different treatments (Pharmacological treatments = blue; non-pharmacological treatments = red; data as in Figure 4). (Bottom) Bidimensional plots of the pharmacological (blue) and non-pharmacological (red) treatment effectiveness. The coordinates of each treatment are the average values of effectiveness reported by subjects rating as “low” (horizontal axis) or “high” (vertical axis) in the PD-Q test. In the left panel, the perpendicular dotted lines, intersecting axes at global mean values, show that most non-pharmacological treatments are generally more effective than pharmacological ones. In the right panel, the axes bisector (dotted line) shows that most treatments are judged more effective by “low” subjects. Statistical comparisons by the Wilcoxon test show that non-pharmacological treatments are judged more effective than pharmacological ones by the whole population of patients (n = 344, p = 2.03 × 10⁻¹¹), as well as by analyzing separately “high” subjects (n = 233, p = 5 × 10⁻⁸) or “low” subjects (n = 38, p = 0.018). Mind-body therapies have been reported as the most effective in absolute. Non-pharmacological treatments: acup = acupuncture; diet = diet therapy; mass = massages; instr = non-invasive instrumental treatments; phys = physical therapy; psycho = psychotherapy; relax = relaxation therapy. Pharmacological treatments: analg = analgesics; antid = antidepressants; NSAID = non-steroidal anti-inflammatory drugs; ster = steroids.

